> ## Documentation Index
> Fetch the complete documentation index at: https://docs.flashcat.cloud/llms.txt
> Use this file to discover all available pages before exploring further.
# Web
> Learn about the Flashduty RUM Insights dashboard features and usage
## Overview
Flashduty RUM Insights dashboard provides out-of-the-box visualization dashboards that automatically collect and analyze multi-dimensional data including user sessions, performance, resources, and errors. This helps you gain comprehensive insights into your application's real-world performance, quickly identify performance bottlenecks and issues, and continuously optimize user experience.
The Insights dashboard includes four main analysis dimensions:
Key metrics at a glance
Comprehensive application experience monitoring
Quick error identification and diagnosis
Fine-grained resource optimization
## Overview
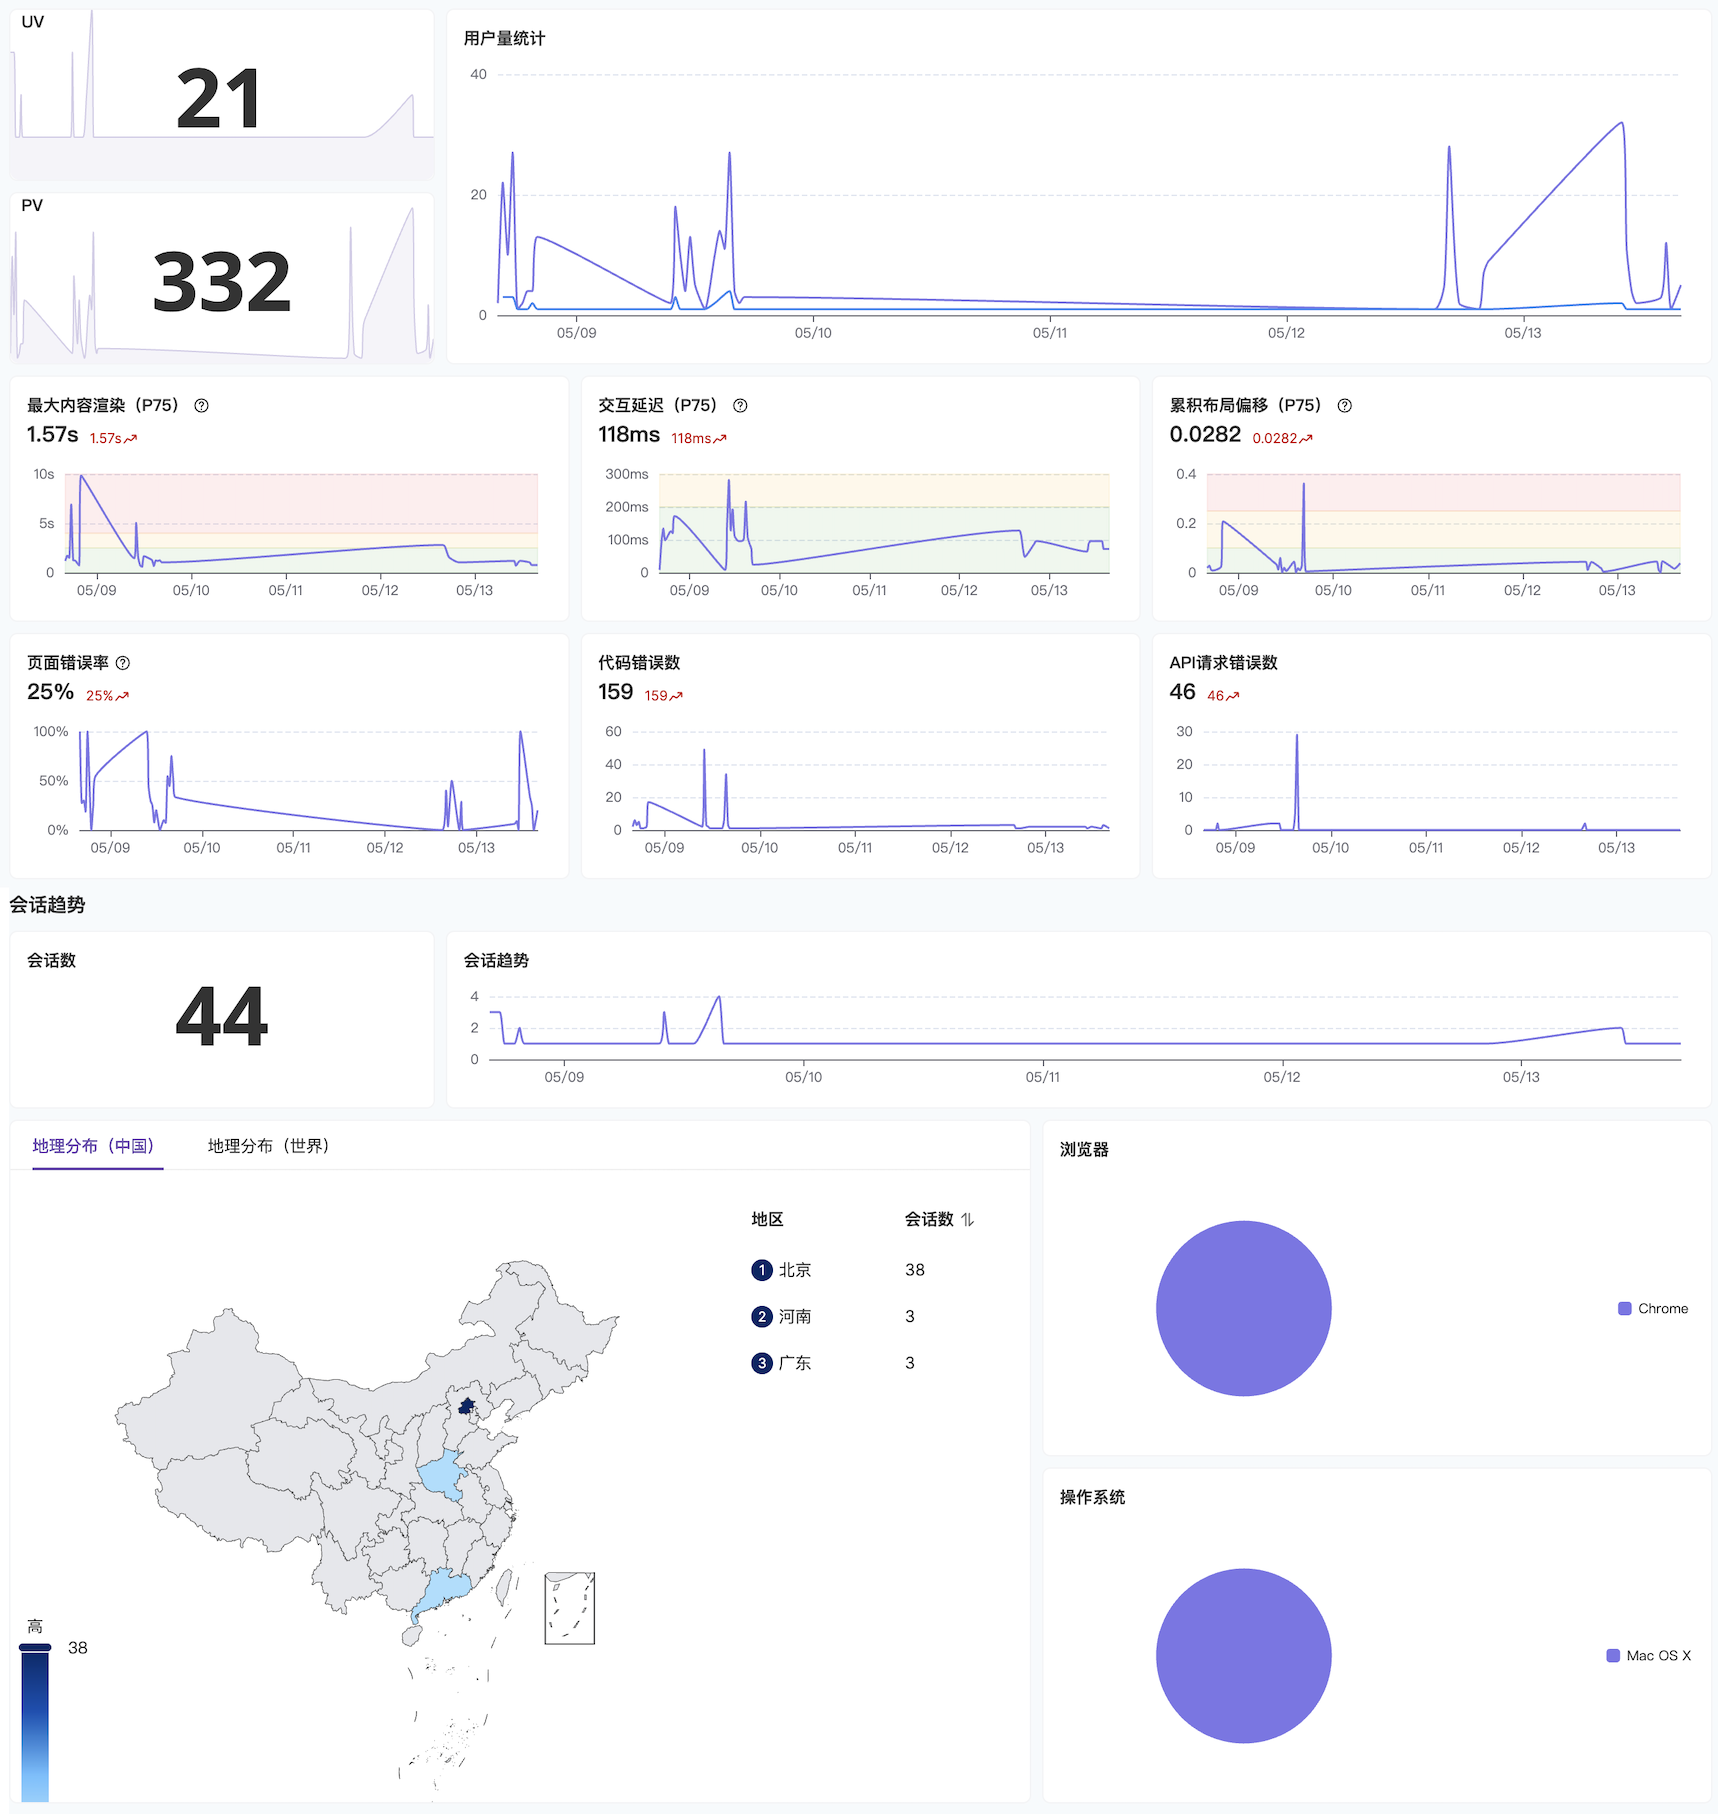 The Overview module focuses on core metrics across multiple dimensions:
| Metric Type | Description |
| -------------------------------- | --------------------------------------------------------------------------------------------------------------- |
| **Traffic Metrics** | Monitor PV (Page Views), UV (Unique Visitors), and sessions to understand overall traffic trends |
| **User Distribution** | Gain insights into user sources and active regions based on geographic location and device types |
| **Health & Performance Metrics** | Display Core Web Vitals: LCP (Largest Contentful Paint), FID (First Input Delay), CLS (Cumulative Layout Shift) |
| **Errors & Exceptions** | Track error rates by type to quickly identify potential risk areas |
## Performance Analysis
The Overview module focuses on core metrics across multiple dimensions:
| Metric Type | Description |
| -------------------------------- | --------------------------------------------------------------------------------------------------------------- |
| **Traffic Metrics** | Monitor PV (Page Views), UV (Unique Visitors), and sessions to understand overall traffic trends |
| **User Distribution** | Gain insights into user sources and active regions based on geographic location and device types |
| **Health & Performance Metrics** | Display Core Web Vitals: LCP (Largest Contentful Paint), FID (First Input Delay), CLS (Cumulative Layout Shift) |
| **Errors & Exceptions** | Track error rates by type to quickly identify potential risk areas |
## Performance Analysis
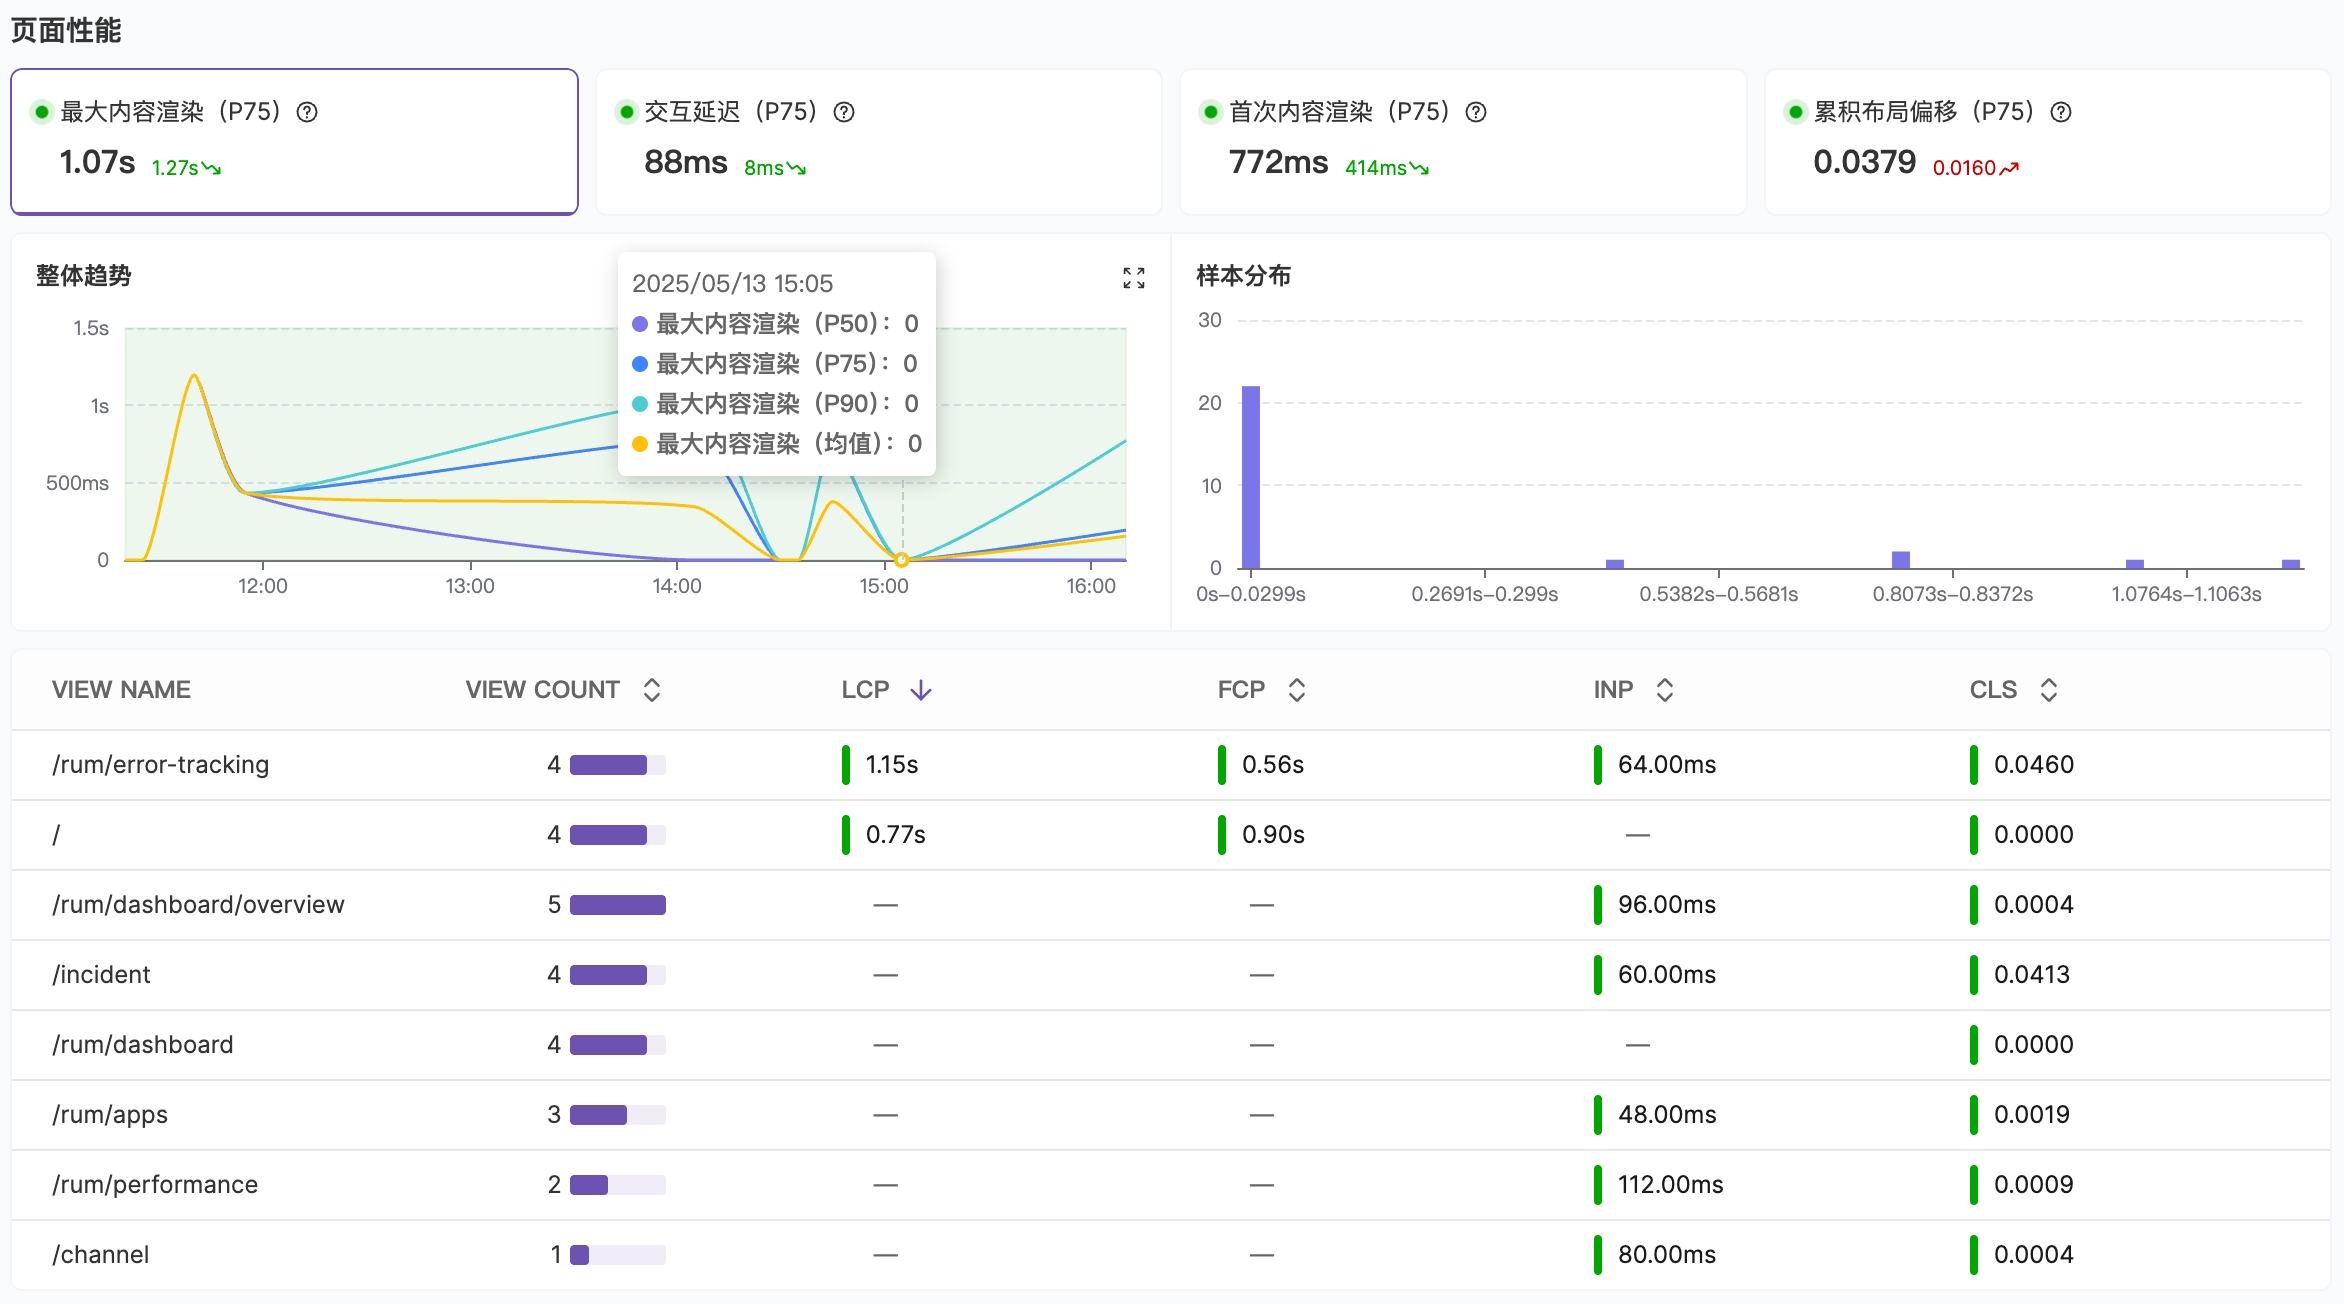 The Performance Analysis module focuses on full-chain monitoring of application loading and interaction experience:
* **Page Performance**: Monitor trends and sample distribution of core page loading metrics like FCP, LCP, and CLS
* **Long Tasks**: [Long Animation Frames](https://developer.chrome.com/docs/web-platform/long-animation-frames#long-frames-api) where rendering updates are delayed beyond 50 milliseconds
* **XHR and Fetch Requests**: Analyze API loading performance to identify slow endpoints
* **Static Resources**: Analyze static resource loading times to identify performance bottlenecks during application loading
For more information about the displayed data, see [Data Collection](/en/rum/others/data-collection).
## Error Analysis
The Performance Analysis module focuses on full-chain monitoring of application loading and interaction experience:
* **Page Performance**: Monitor trends and sample distribution of core page loading metrics like FCP, LCP, and CLS
* **Long Tasks**: [Long Animation Frames](https://developer.chrome.com/docs/web-platform/long-animation-frames#long-frames-api) where rendering updates are delayed beyond 50 milliseconds
* **XHR and Fetch Requests**: Analyze API loading performance to identify slow endpoints
* **Static Resources**: Analyze static resource loading times to identify performance bottlenecks during application loading
For more information about the displayed data, see [Data Collection](/en/rum/others/data-collection).
## Error Analysis
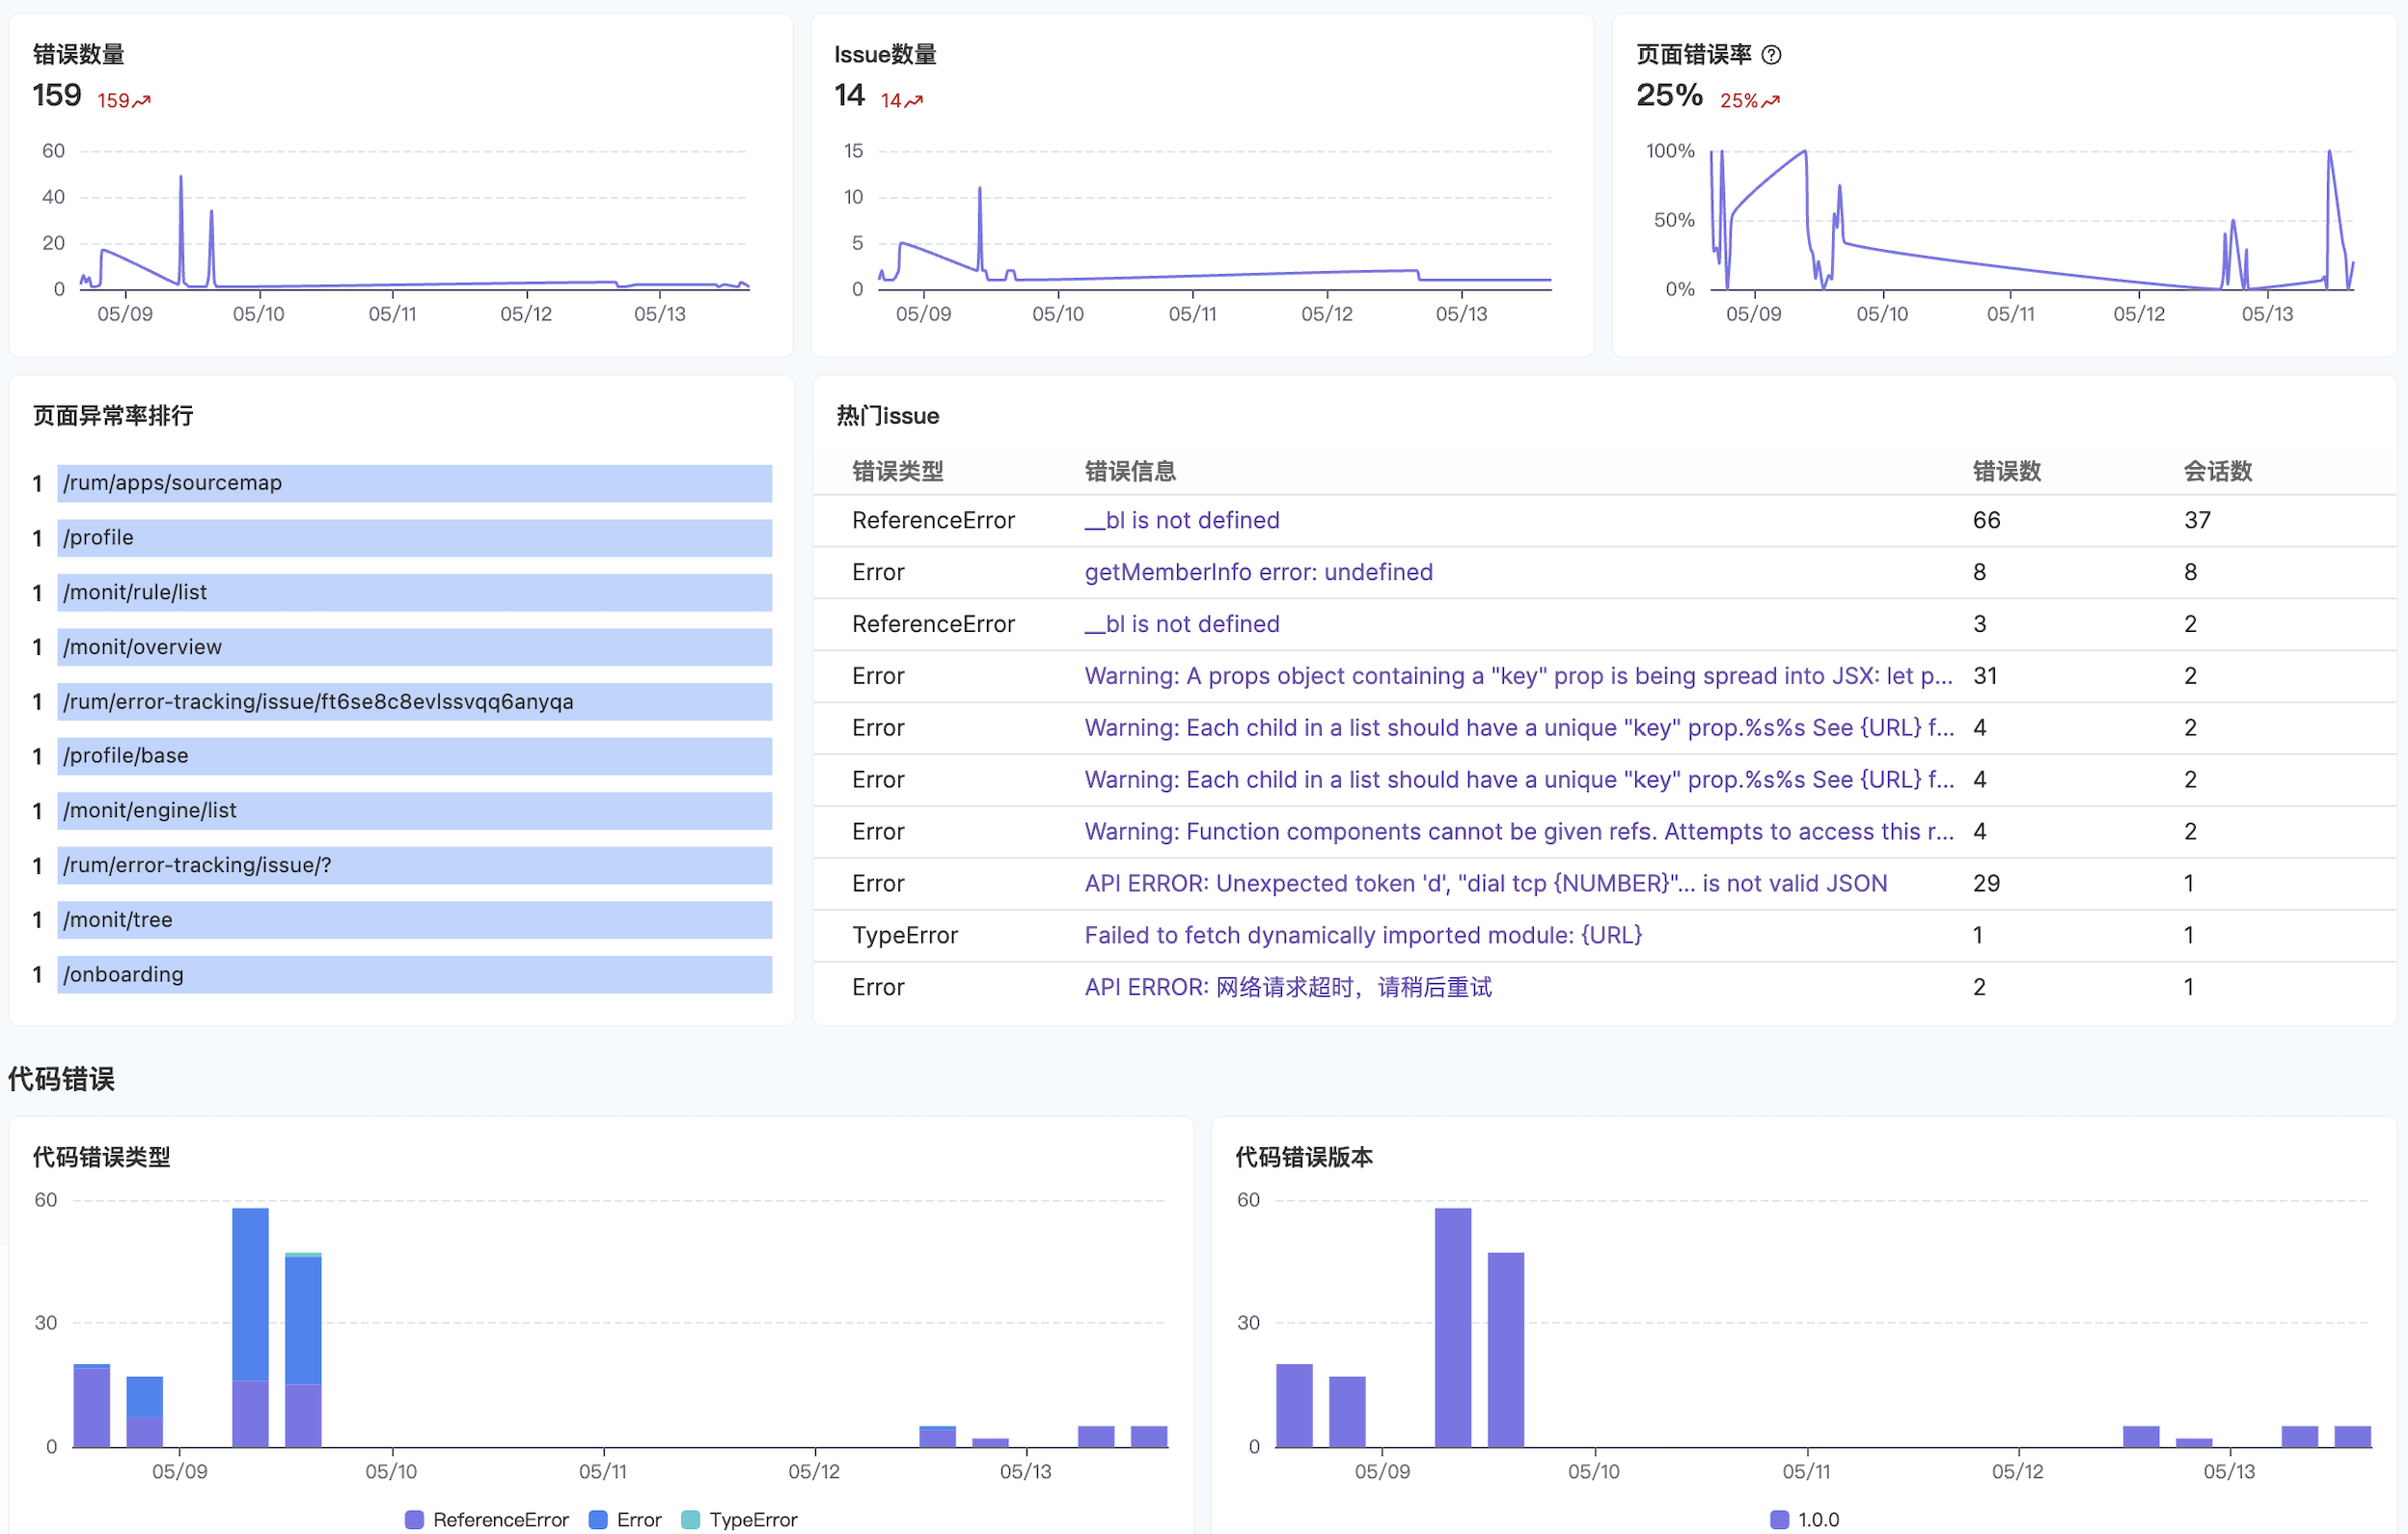 The Error Analysis module provides comprehensive error monitoring and diagnosis capabilities:
* **Page Error Rate**: Pages with the most errors, helping you prioritize which pages need attention
* **Top Issues**: Issues affecting the most users, see [Error Grouping](/en/rum/error-tracking/error-aggregation) for details
* **Code Errors**: Categorized display of error types, see [Error Tracking](/en/rum/error-tracking/overview) for details
* **API and Resource Errors**: Monitor which APIs and static resources generate the most errors
## Resource Analysis
The Error Analysis module provides comprehensive error monitoring and diagnosis capabilities:
* **Page Error Rate**: Pages with the most errors, helping you prioritize which pages need attention
* **Top Issues**: Issues affecting the most users, see [Error Grouping](/en/rum/error-tracking/error-aggregation) for details
* **Code Errors**: Categorized display of error types, see [Error Tracking](/en/rum/error-tracking/overview) for details
* **API and Resource Errors**: Monitor which APIs and static resources generate the most errors
## Resource Analysis
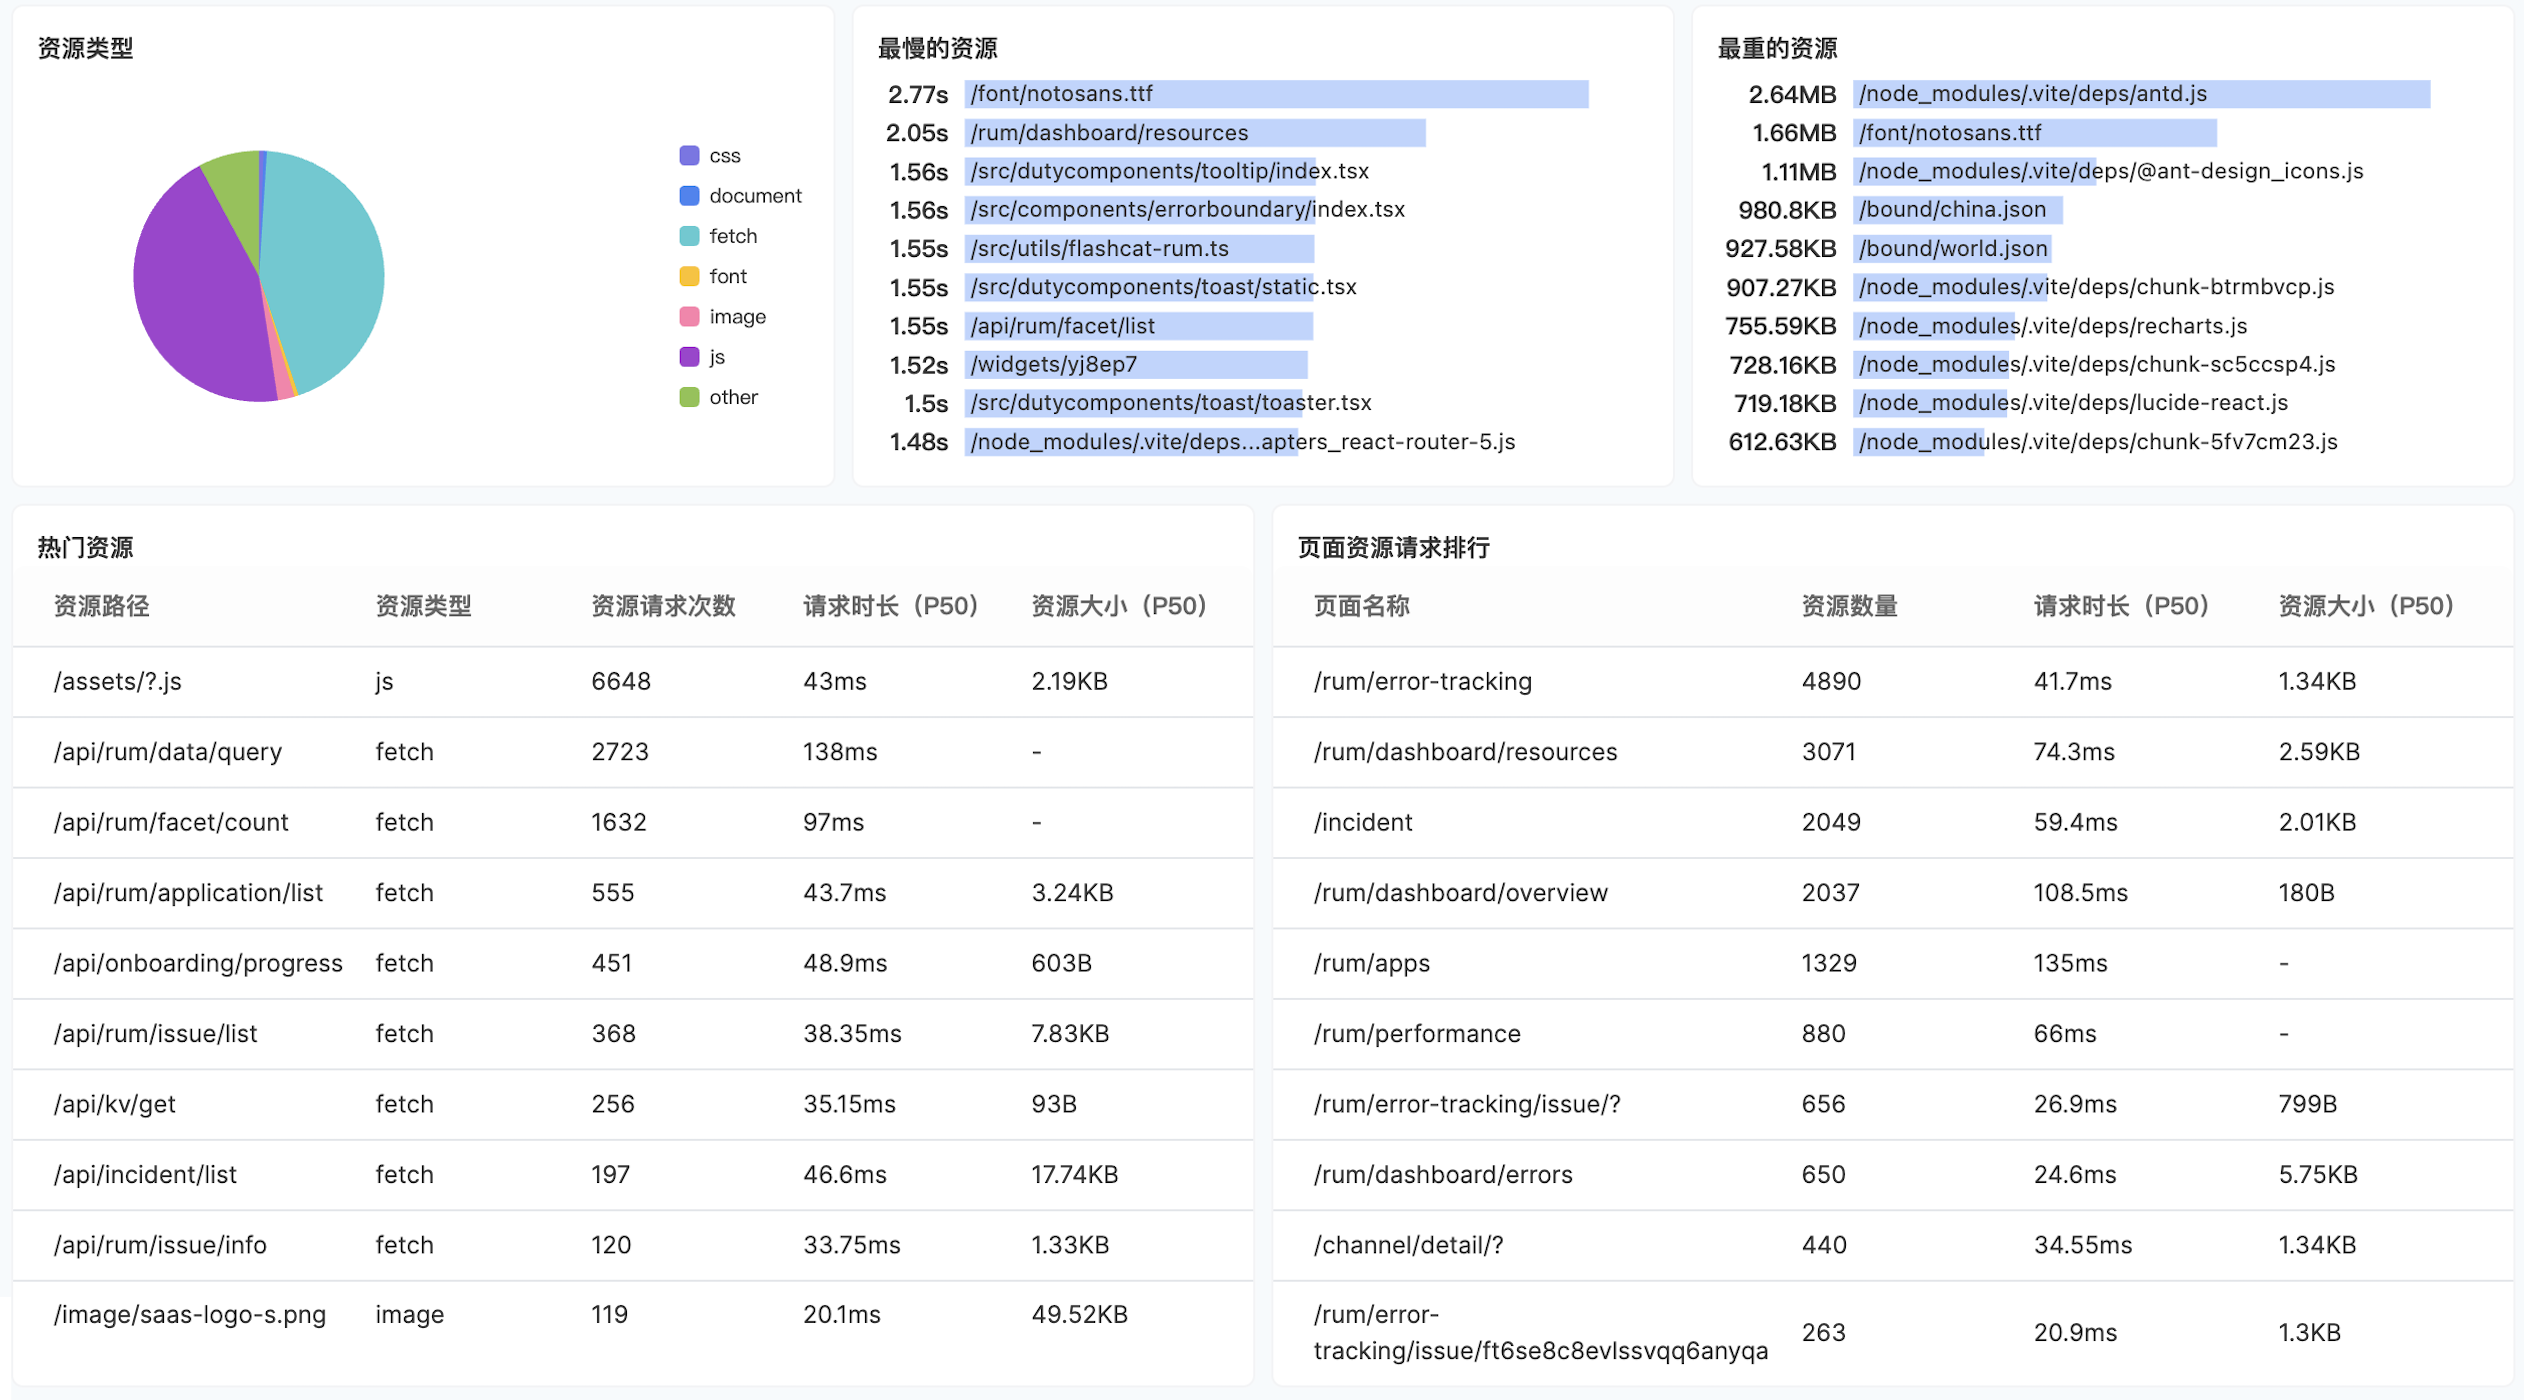 The Resource Analysis module helps you identify resources that have the greatest impact on your application:
* **Resource Ranking**: Monitor the most frequently loaded and heaviest resources to identify optimization priorities
* **Resource Loading Timeline**: Monitor resource timing trends (DNS resolution, TCP connection, loading time, etc.)
* **XHR and Fetch Requests**: Distinguish distribution trends of different request types, methods, and error status codes
* **Third-party Resources**: Resources where the host address doesn't match the current page host are identified as third-party resources
### Traffic Distribution
The Traffic Distribution module helps you analyze the request distribution between self-hosted and third-party resources, identifying the impact of external dependencies on application performance.
This module contains three parts:
| Part | Description |
| ------------------ | -------------------------------------------------------------------------------------------------------------------------------------------------------------------------------------------------------------------------- |
| **Resource List** | Aggregates resources by domain (Host), showing request count, P90/P50 duration, success rate, and resource provider category (self-hosted or third-party). Supports domain regex filtering and provider category filtering |
| **Duration Trend** | Displays a line chart comparing P90 duration trends between self-hosted and third-party resources, helping you determine whether third-party resources are slowing down overall loading speed |
| **Traffic Share** | Displays a pie chart showing the request volume share of each third-party domain, providing a clear view of traffic distribution across third-party services |
You can click the fullscreen button in the resource list to view more detailed data, and use the sorting feature to quickly locate domains with the longest duration or highest request volume.
## FAQ
This may occur due to:
1. **Connection Reuse (Keep-Alive)**: When resource requests use keep-alive to maintain connections, DNS lookups and TCP connection processes only occur on the first request, with subsequent requests reusing the same connection
2. **Cross-origin Resources**: If resources are loaded cross-origin without the appropriate headers configured, the browser cannot collect complete performance data (primary cause)
3. **Browser Compatibility**: In rare cases, some browsers may not support the Performance API
1. **Cross-origin Resources**: If resources are loaded cross-origin without cross-origin access permissions set, the browser cannot obtain resource status information
2. **Browser Compatibility**: Some browsers may not support the Performance API (rare)
**1. Collect timing data for cross-origin resources**
Add the following to the HTTP response headers of cross-origin resources:
```
Timing-Allow-Origin: *
```
See MDN documentation [Resource Timing API](https://developer.mozilla.org/en-US/docs/Web/API/Performance_API/Resource_timing#cross-origin_timing_information).
**2. Collect status codes for cross-origin resources**
Add the following to the HTTP response headers of cross-origin resources:
```
Access-Control-Allow-Origin: *
```
Add `crossorigin="anonymous"` to the HTML tags that reference the resource:
```html theme={null}
The Resource Analysis module helps you identify resources that have the greatest impact on your application:
* **Resource Ranking**: Monitor the most frequently loaded and heaviest resources to identify optimization priorities
* **Resource Loading Timeline**: Monitor resource timing trends (DNS resolution, TCP connection, loading time, etc.)
* **XHR and Fetch Requests**: Distinguish distribution trends of different request types, methods, and error status codes
* **Third-party Resources**: Resources where the host address doesn't match the current page host are identified as third-party resources
### Traffic Distribution
The Traffic Distribution module helps you analyze the request distribution between self-hosted and third-party resources, identifying the impact of external dependencies on application performance.
This module contains three parts:
| Part | Description |
| ------------------ | -------------------------------------------------------------------------------------------------------------------------------------------------------------------------------------------------------------------------- |
| **Resource List** | Aggregates resources by domain (Host), showing request count, P90/P50 duration, success rate, and resource provider category (self-hosted or third-party). Supports domain regex filtering and provider category filtering |
| **Duration Trend** | Displays a line chart comparing P90 duration trends between self-hosted and third-party resources, helping you determine whether third-party resources are slowing down overall loading speed |
| **Traffic Share** | Displays a pie chart showing the request volume share of each third-party domain, providing a clear view of traffic distribution across third-party services |
You can click the fullscreen button in the resource list to view more detailed data, and use the sorting feature to quickly locate domains with the longest duration or highest request volume.
## FAQ
This may occur due to:
1. **Connection Reuse (Keep-Alive)**: When resource requests use keep-alive to maintain connections, DNS lookups and TCP connection processes only occur on the first request, with subsequent requests reusing the same connection
2. **Cross-origin Resources**: If resources are loaded cross-origin without the appropriate headers configured, the browser cannot collect complete performance data (primary cause)
3. **Browser Compatibility**: In rare cases, some browsers may not support the Performance API
1. **Cross-origin Resources**: If resources are loaded cross-origin without cross-origin access permissions set, the browser cannot obtain resource status information
2. **Browser Compatibility**: Some browsers may not support the Performance API (rare)
**1. Collect timing data for cross-origin resources**
Add the following to the HTTP response headers of cross-origin resources:
```
Timing-Allow-Origin: *
```
See MDN documentation [Resource Timing API](https://developer.mozilla.org/en-US/docs/Web/API/Performance_API/Resource_timing#cross-origin_timing_information).
**2. Collect status codes for cross-origin resources**
Add the following to the HTTP response headers of cross-origin resources:
```
Access-Control-Allow-Origin: *
```
Add `crossorigin="anonymous"` to the HTML tags that reference the resource:
```html theme={null}
 ```
See MDN documentation [Access-Control-Allow-Origin](https://developer.mozilla.org/en-US/docs/Web/HTTP/Headers/Access-Control-Allow-Origin) and [crossorigin attribute](https://developer.mozilla.org/en-US/docs/Web/HTML/Attributes/crossorigin).
**Logged-in User Identification**
For applications that require user login (such as SaaS products, membership systems, e-commerce platforms, etc.), see [User Sessions](/en/rum/sdk/web/advanced-config#user-sessions).
**Device Fingerprint Identification**
For applications without login state (such as corporate websites, marketing pages, etc.), we recommend generating stable fingerprints based on multi-dimensional data like browser characteristics and device information, then reporting them as user identifiers.
```
See MDN documentation [Access-Control-Allow-Origin](https://developer.mozilla.org/en-US/docs/Web/HTTP/Headers/Access-Control-Allow-Origin) and [crossorigin attribute](https://developer.mozilla.org/en-US/docs/Web/HTML/Attributes/crossorigin).
**Logged-in User Identification**
For applications that require user login (such as SaaS products, membership systems, e-commerce platforms, etc.), see [User Sessions](/en/rum/sdk/web/advanced-config#user-sessions).
**Device Fingerprint Identification**
For applications without login state (such as corporate websites, marketing pages, etc.), we recommend generating stable fingerprints based on multi-dimensional data like browser characteristics and device information, then reporting them as user identifiers.