> ## Documentation Index
> Fetch the complete documentation index at: https://docs.flashcat.cloud/llms.txt
> Use this file to discover all available pages before exploring further.
# Distributed Tracing
> Learn how to configure and use distributed tracing in Flashduty RUM to achieve complete monitoring of frontend-backend request chains
## Overview
Flashduty RUM's **Trace Tracking** feature deeply integrates frontend user monitoring with distributed tracing systems, allowing you to associate requests from your web application with their corresponding backend traces. This combination enables you to view complete frontend and backend data at a glance, achieving end-to-end performance monitoring and troubleshooting.
With Trace Tracking, you can:
* **Correlate frontend and backend requests**: Associate frontend user actions with backend API calls
* **End-to-end troubleshooting**: Quickly locate complete request chain issues from frontend to backend
* **Performance bottleneck analysis**: Identify performance bottleneck points throughout the entire request chain
* **User experience optimization**: Optimize user experience based on complete request chain data
## How It Works
Trace Tracking is implemented based on the [W3C Trace Context](https://www.w3.org/TR/trace-context/) standard, correlating frontend and backend requests by injecting tracing information into HTTP request headers:
RUM SDK automatically adds tracing header information to configured API requests
Backend service receives and processes requests with tracing information
Frontend and backend data are correlated through the same `trace_id`
View complete request chain information through trace correlation based on `trace_id`
## Configuration Steps
### 1. SDK Configuration
First, configure the distributed tracing feature in the RUM SDK. Add the following parameters when initializing the RUM SDK:
```javascript theme={null}
import { flashcatRum } from "@flashcatcloud/browser-rum";
flashcatRum.init({
applicationId: "",
clientToken: "",
service: "",
env: "",
version: "1.0.0",
sessionSampleRate: 100,
allowedTracingUrls: [
"https://api.example.com",
/https:\/\/.*\.my-api-domain\.com/,
(url) => url.startsWith("https://api.example.com")
],
traceSampleRate: 20
});
```
#### Key Configuration Parameters
Specify API endpoints that need tracing information added, supporting the following types:
| Type | Description | Example |
| ------------ | ----------------------------------------------- | ---------------------------------------- |
| **String** | Matches URLs starting with this value | `"https://api.example.com"` |
| **RegExp** | Uses regular expression to match URLs | `/https:\/\/.*\.my-api-domain\.com/` |
| **Function** | Custom matching logic, returns `true` for match | `(url) => url.startsWith("https://api")` |
Trace sampling rate, controls what percentage of requests will be traced (range 0-100)
For production environments, it's recommended to set `traceSampleRate` to 10-20 to balance monitoring coverage and performance impact.
### 2. Application Management Configuration
After SDK configuration is complete, configure trace jump links from the **Link Integration** tab in application details:
1. Go to the **Application Management** page
2. Select the corresponding RUM application and open the **Link Integration** tab
3. Enter the tracing system jump link in the **Tracing** card
4. Save the link, then turn on the **Tracing** switch
In the configured jump link, RUM automatically replaces `${trace_id}` with the actual trace\_id from the resource event. Built-in Tracing appears only when a resource event contains `trace_id`.
### 3. Backend Service Configuration
To fully support distributed tracing, backend services need to:
1. **Receive tracing headers**: Process `traceparent` and `tracestate` request headers
2. **Pass tracing information**: Continue passing tracing headers when calling other services
3. **Generate tracing data**: Record request processing to the tracing system
## Tracing Header Information
The RUM SDK automatically adds the following HTTP headers to configured requests:
### traceparent Header
```
traceparent: 00-00000000000000008448eb211c80319c-b7ad6b7169203331-01
```
Format: `[version]-[trace-id]-[parent-id]-[trace-flags]`
| Field | Description |
| ------------- | ------------------------------------------------------------ |
| `version` | Currently `00` |
| `trace-id` | 128-bit trace ID, 32 characters after hexadecimal processing |
| `parent-id` | 64-bit span ID, 16 characters after hexadecimal processing |
| `trace-flags` | Sampling flag, `01` means sampled, `00` means not sampled |
### tracestate Header
```
tracestate: dd=s:1;o:rum
```
Format: `dd=s:[sampling-priority];o:[origin]`
| Field | Description |
| ------------------- | ----------------------------------------------- |
| `sampling-priority` | `1` means trace is sampled |
| `origin` | Always `rum`, indicating collection via RUM SDK |
## Use Cases
### View Trace in RUM Explorer
After configuration is complete, resource events that contain `trace_id` show a Tracing jump entry:
1. Go to **RUM Explorer**
2. Filter for or open a resource event that contains API calls
3. Click the trace link in the `trace_id` column of the resource list, or open **Related Links** from the top-right corner of the event details
4. Jump to your trace system to view the detailed request chain
### Find Resources by trace\_id
You can also search for resources in the explorer using `trace_id`:
1. Enter `trace_id` in the explorer search bar
2. View corresponding resources and view loading status
3. Analyze the relationship between resource loading performance and backend API calls
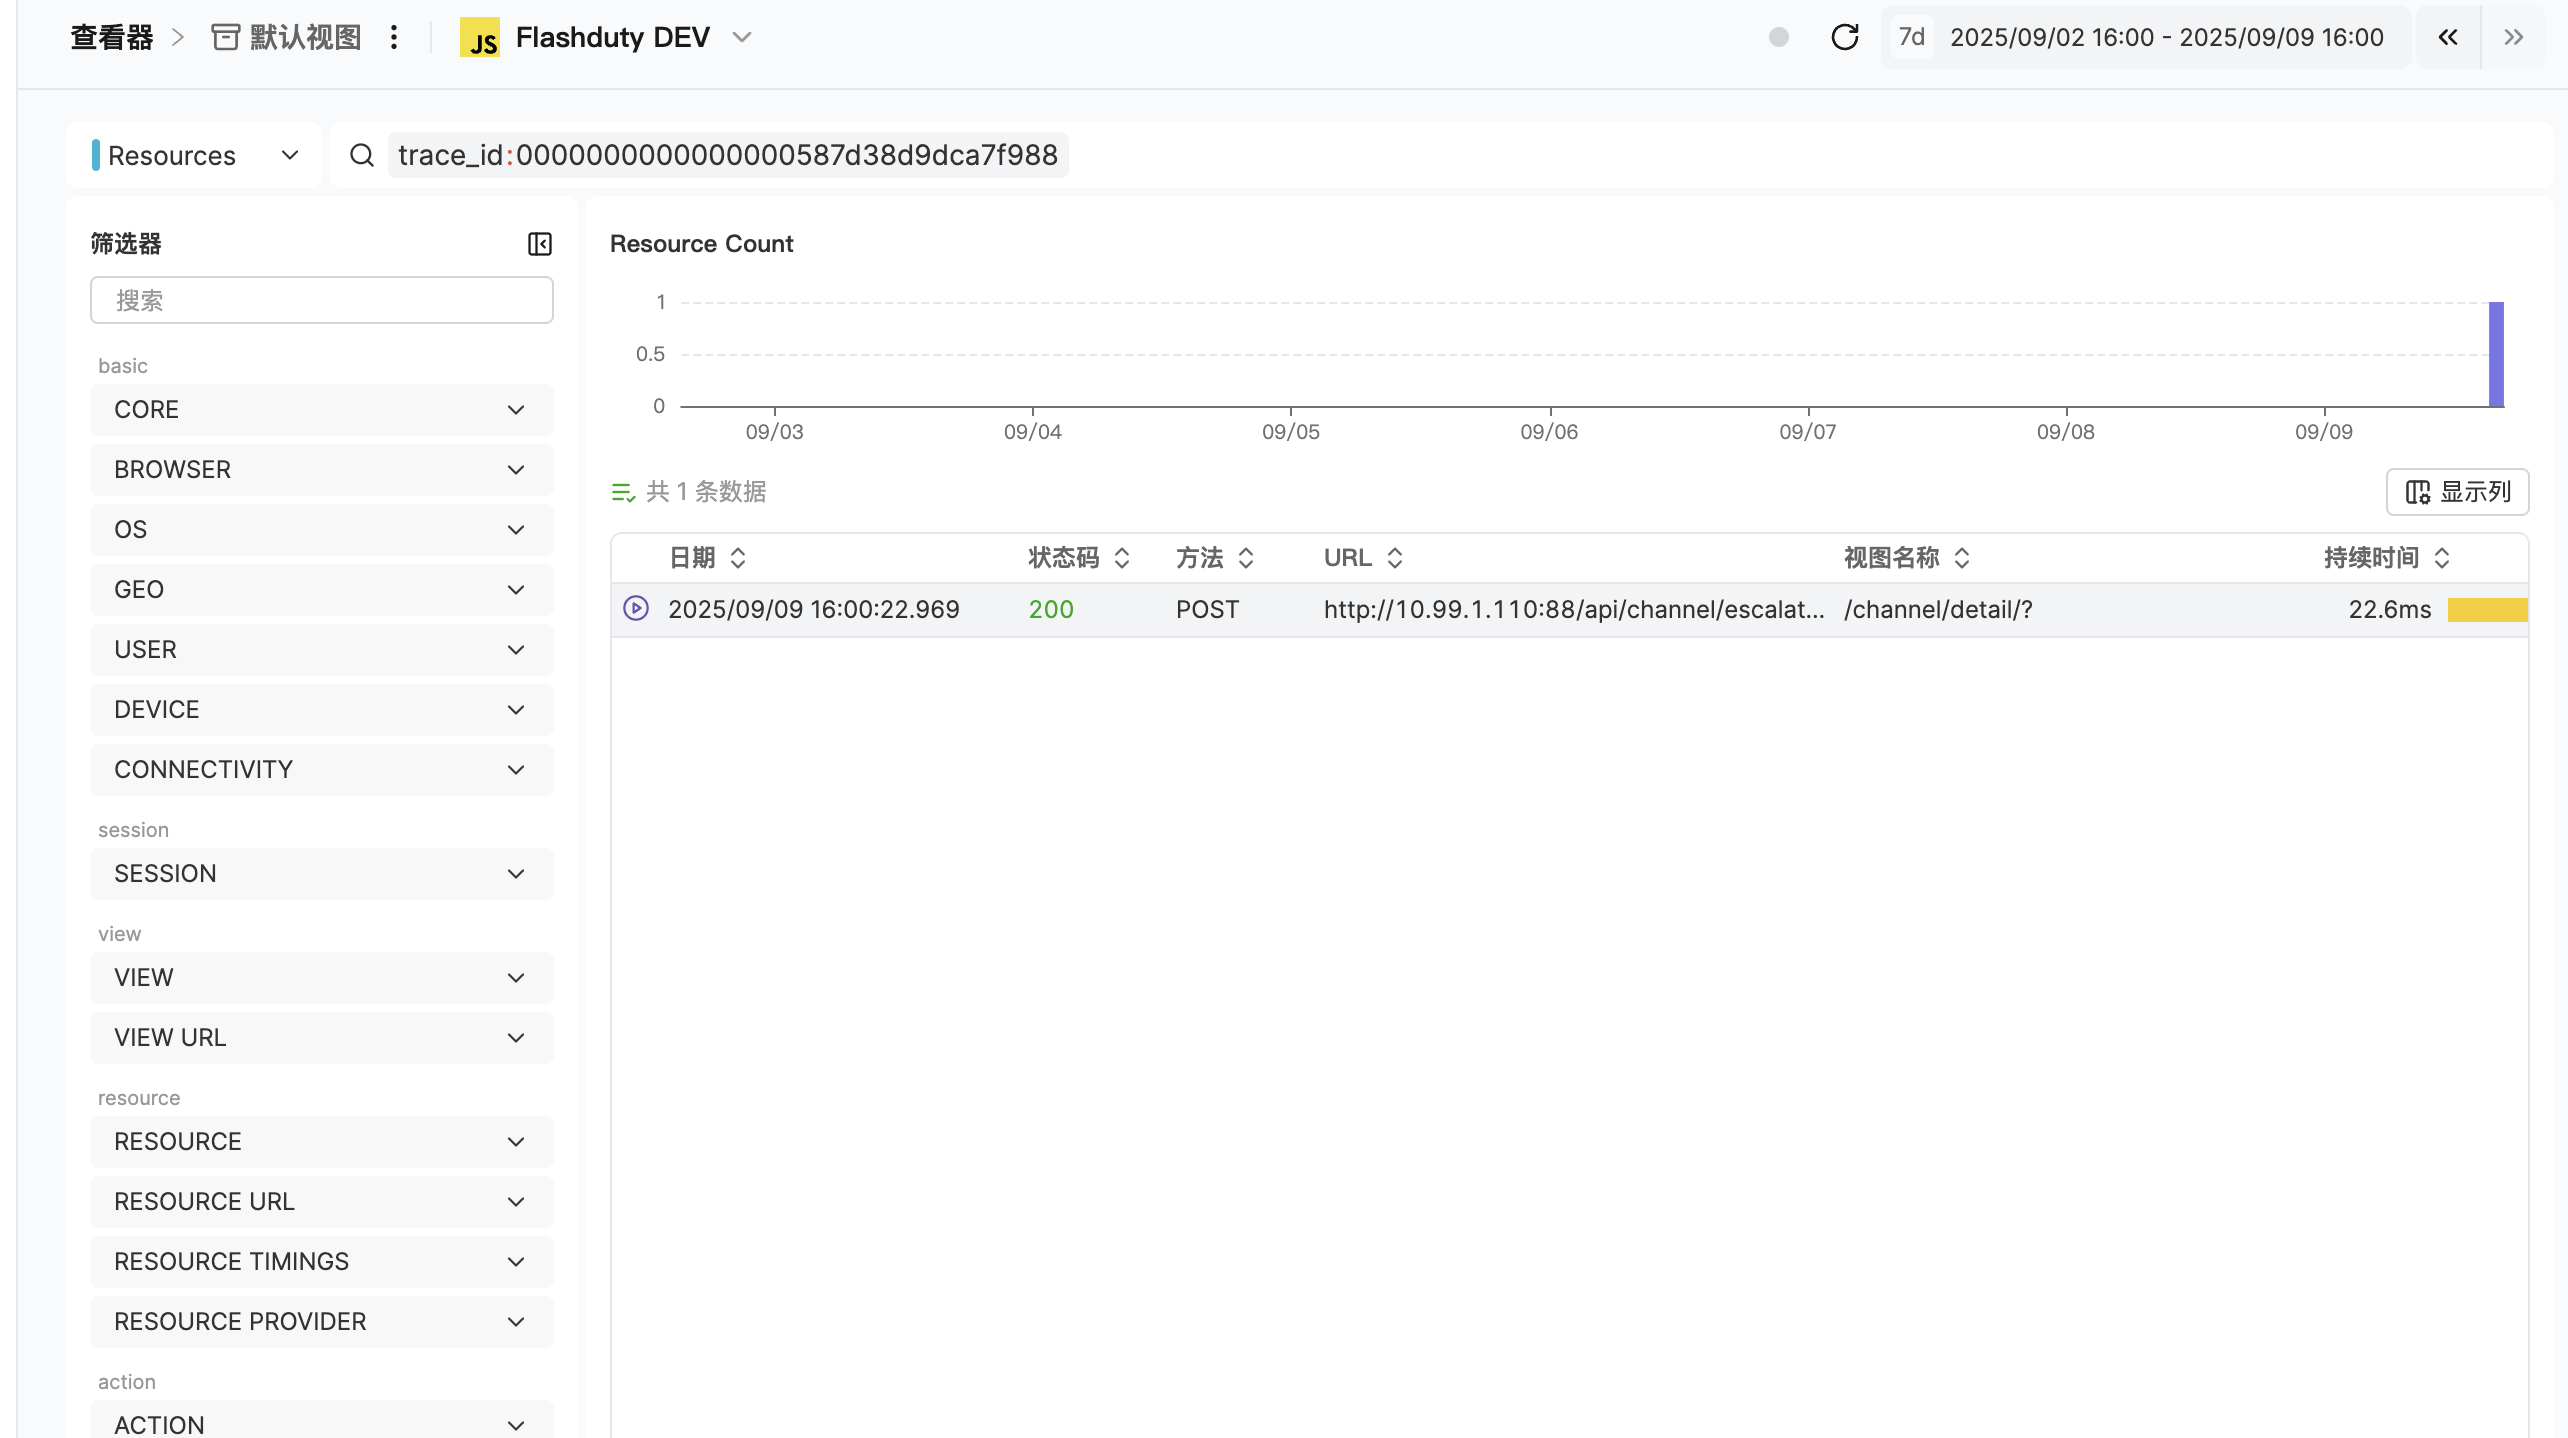 You can also query corresponding resources directly by appending parameters to the URL:
```
https://console.flashcat.cloud/rum/explorer?appid=${YOUR_APP_ID}&end=${END_TIME}&eventType=resource&queryStr=trace_id%3A${TRACE_ID}&start=${START_TIME}
```
Where `start`, `end`, and `appid` are all optional parameters. If not provided, the current RUM default query application and time range will be used.
### End-to-End Troubleshooting
When users report performance issues or errors:
Find the problem user's session in the RUM Explorer
View trace information for the problem page
Jump to the trace system to view the complete request chain
Determine if it's a frontend issue, service issue, or network issue
## Best Practices
### Configure Sampling Rate Appropriately
| Environment | Recommended Rate | Description |
| --------------- | ---------------- | ------------------------------------------- |
| **Development** | 100% | Ensure all requests are traced |
| **Testing** | 50-80% | Balance monitoring coverage and performance |
| **Production** | 10-20% | Avoid significant performance impact |
### Precisely Configure Tracing URLs
Precisely match API endpoints:
```javascript theme={null}
allowedTracingUrls: [
"https://api.example.com/v1/",
"https://api.example.com/v2/"
]
```
Overly broad matching may include static resources that don't need tracing:
```javascript theme={null}
// Not recommended
allowedTracingUrls: [
"https://api.example.com"
]
```
### Cross-Origin Request Handling
If your HTTP requests involve cross-origin issues, ensure:
* Server has correct CORS headers configured
* Supports Preflight Requests
* Allows `traceparent` and `tracestate` headers
### Performance Monitoring
* Regularly check the impact of trace sampling rate on application performance
* Monitor storage and query performance of tracing data
* Adjust tracing strategy based on business needs
## Frequently Asked Questions
Possible reasons include:
* Request URL is not within the `allowedTracingUrls` configuration range
* Request was filtered by `traceSampleRate` sampling rate
* Request was initiated before SDK initialization
* Cross-origin request lacks necessary CORS configuration
You can verify through the following methods:
1. Check network request headers in browser developer tools
2. Confirm requests contain `traceparent` and `tracestate` headers
3. Check if trace information is displayed in the RUM Explorer
## Important Notes
* **Privacy Compliance**: Ensure trace data collection complies with relevant privacy regulations
* **Performance Impact**: Set sampling rate appropriately to avoid significant impact on application performance
* **Data Security**: Avoid including sensitive information in trace data
* **Cross-Origin Configuration**: Ensure backend services have CORS properly configured to support tracing headers
You can also query corresponding resources directly by appending parameters to the URL:
```
https://console.flashcat.cloud/rum/explorer?appid=${YOUR_APP_ID}&end=${END_TIME}&eventType=resource&queryStr=trace_id%3A${TRACE_ID}&start=${START_TIME}
```
Where `start`, `end`, and `appid` are all optional parameters. If not provided, the current RUM default query application and time range will be used.
### End-to-End Troubleshooting
When users report performance issues or errors:
Find the problem user's session in the RUM Explorer
View trace information for the problem page
Jump to the trace system to view the complete request chain
Determine if it's a frontend issue, service issue, or network issue
## Best Practices
### Configure Sampling Rate Appropriately
| Environment | Recommended Rate | Description |
| --------------- | ---------------- | ------------------------------------------- |
| **Development** | 100% | Ensure all requests are traced |
| **Testing** | 50-80% | Balance monitoring coverage and performance |
| **Production** | 10-20% | Avoid significant performance impact |
### Precisely Configure Tracing URLs
Precisely match API endpoints:
```javascript theme={null}
allowedTracingUrls: [
"https://api.example.com/v1/",
"https://api.example.com/v2/"
]
```
Overly broad matching may include static resources that don't need tracing:
```javascript theme={null}
// Not recommended
allowedTracingUrls: [
"https://api.example.com"
]
```
### Cross-Origin Request Handling
If your HTTP requests involve cross-origin issues, ensure:
* Server has correct CORS headers configured
* Supports Preflight Requests
* Allows `traceparent` and `tracestate` headers
### Performance Monitoring
* Regularly check the impact of trace sampling rate on application performance
* Monitor storage and query performance of tracing data
* Adjust tracing strategy based on business needs
## Frequently Asked Questions
Possible reasons include:
* Request URL is not within the `allowedTracingUrls` configuration range
* Request was filtered by `traceSampleRate` sampling rate
* Request was initiated before SDK initialization
* Cross-origin request lacks necessary CORS configuration
You can verify through the following methods:
1. Check network request headers in browser developer tools
2. Confirm requests contain `traceparent` and `tracestate` headers
3. Check if trace information is displayed in the RUM Explorer
## Important Notes
* **Privacy Compliance**: Ensure trace data collection complies with relevant privacy regulations
* **Performance Impact**: Set sampling rate appropriately to avoid significant impact on application performance
* **Data Security**: Avoid including sensitive information in trace data
* **Cross-Origin Configuration**: Ensure backend services have CORS properly configured to support tracing headers