> ## Documentation Index
> Fetch the complete documentation index at: https://docs.flashcat.cloud/llms.txt
> Use this file to discover all available pages before exploring further.
# Diagnosis Guide
> This document details how to use FlashCat RUM for performance problem diagnosis and optimization.
The optimization page helps identify the root causes of browser performance issues based on real user traffic data. Use browser metrics (such as Core Web Vitals and Flashduty custom loading time metrics) to troubleshoot slow page loading. These metrics can evaluate complete page load time from the user's perspective.
For deeper analysis, the optimization page provides detailed breakdowns of Core Web Vitals by user demographics (such as browser, region, and app version). You can use this information to track performance trends, understand the most affected user groups, and optimize precisely.
## Diagnosis and Optimization Workflow
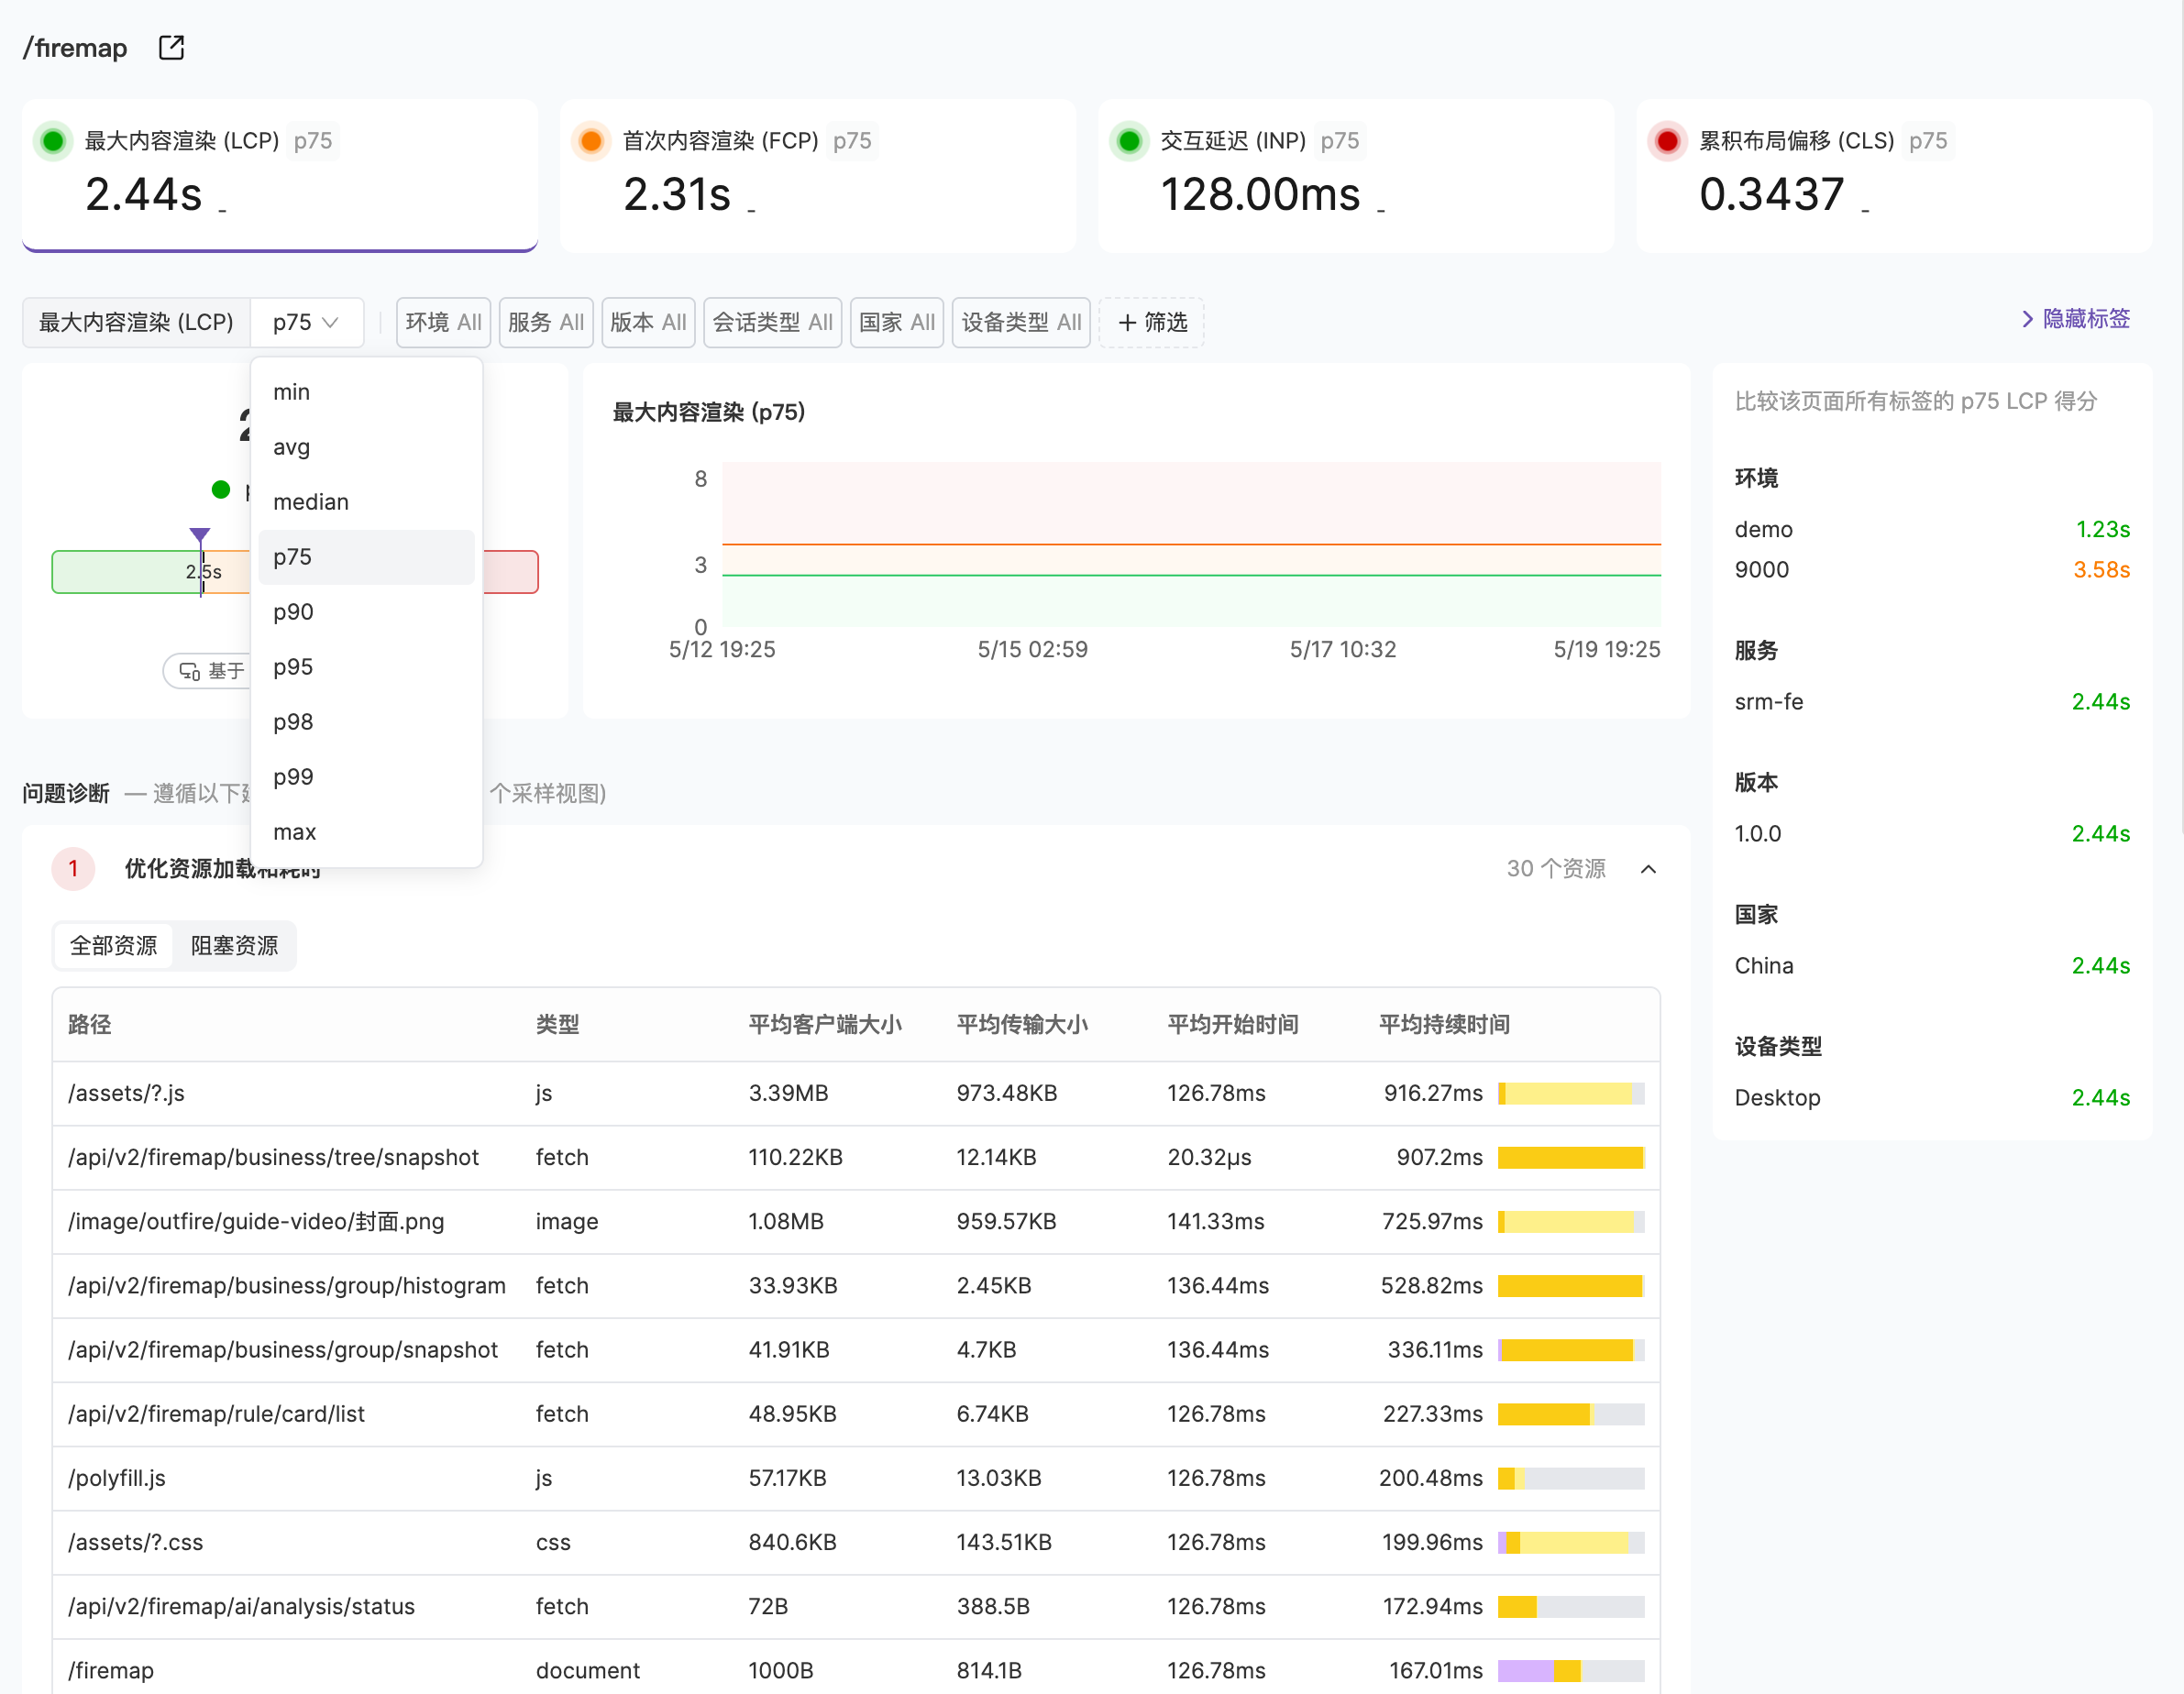
You can navigate to the optimization page, located under the Performance Monitoring menu, and select the metric you want to analyze. You can also jump to this feature by viewing corresponding performance data in the analytics dashboard.
After selecting a page and metric, you can start performance data analysis:
1. Click on a metric card to select the metric to analyze (currently supports LCP, FCP, INP, CLS)
2. Select a group in "Show Filter Breakdown"
3. Evaluate metrics at different percentiles (e.g., p75 represents the 75th percentile value)
You can view the data performance of the metric under different conditions by adjusting the data aggregation method or modifying filter conditions, thereby advancing diagnosis and optimization work.
 In the problem diagnosis section, you can see resources and errors that users encountered on the page that may affect metric performance.
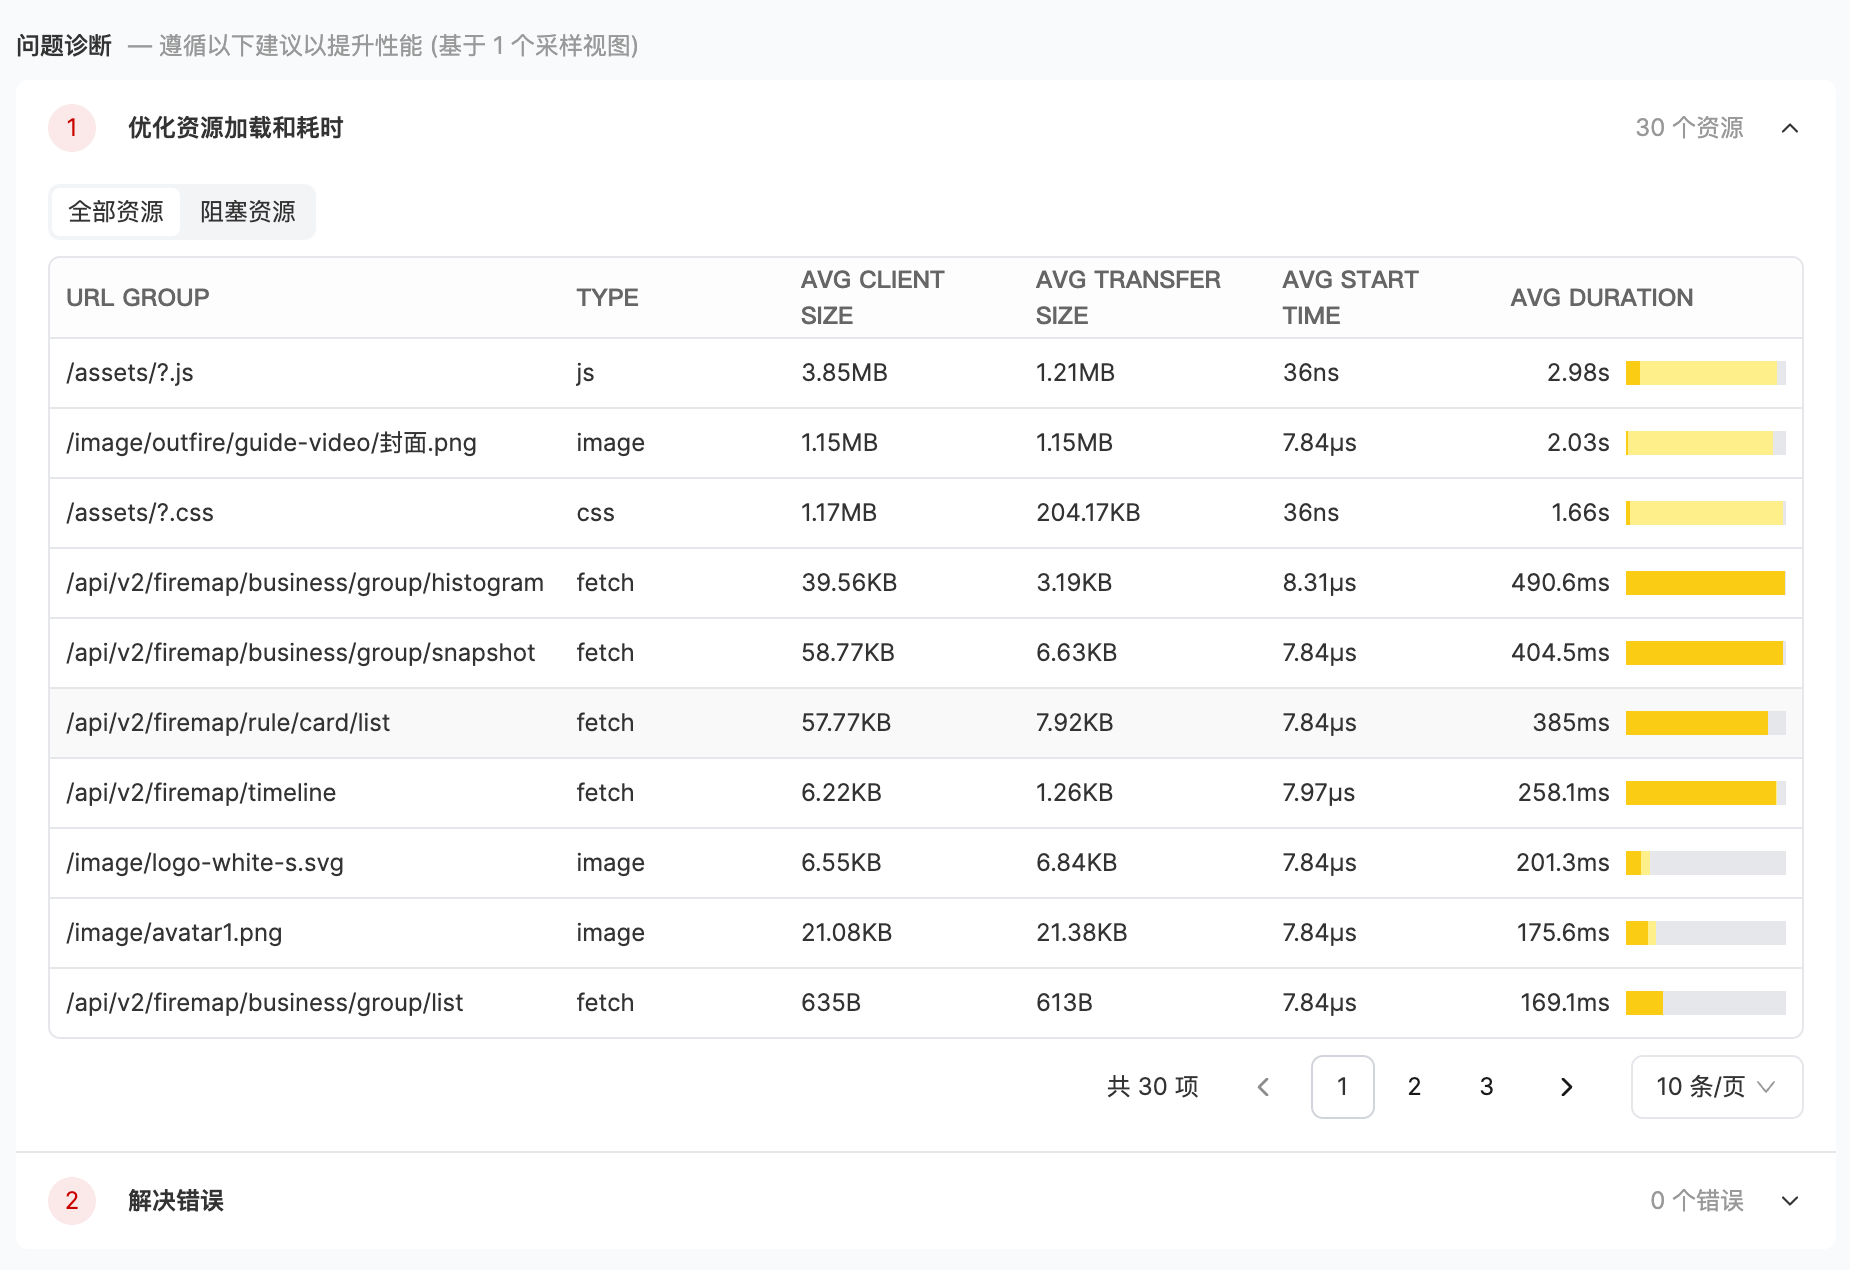 For example, for Largest Contentful Paint (LCP), you can view resources loaded before LCP was triggered. Since LCP is a metric for the time it takes for the largest element to load on the page, you can diagnose problems from both resource loading and error resolution perspectives.
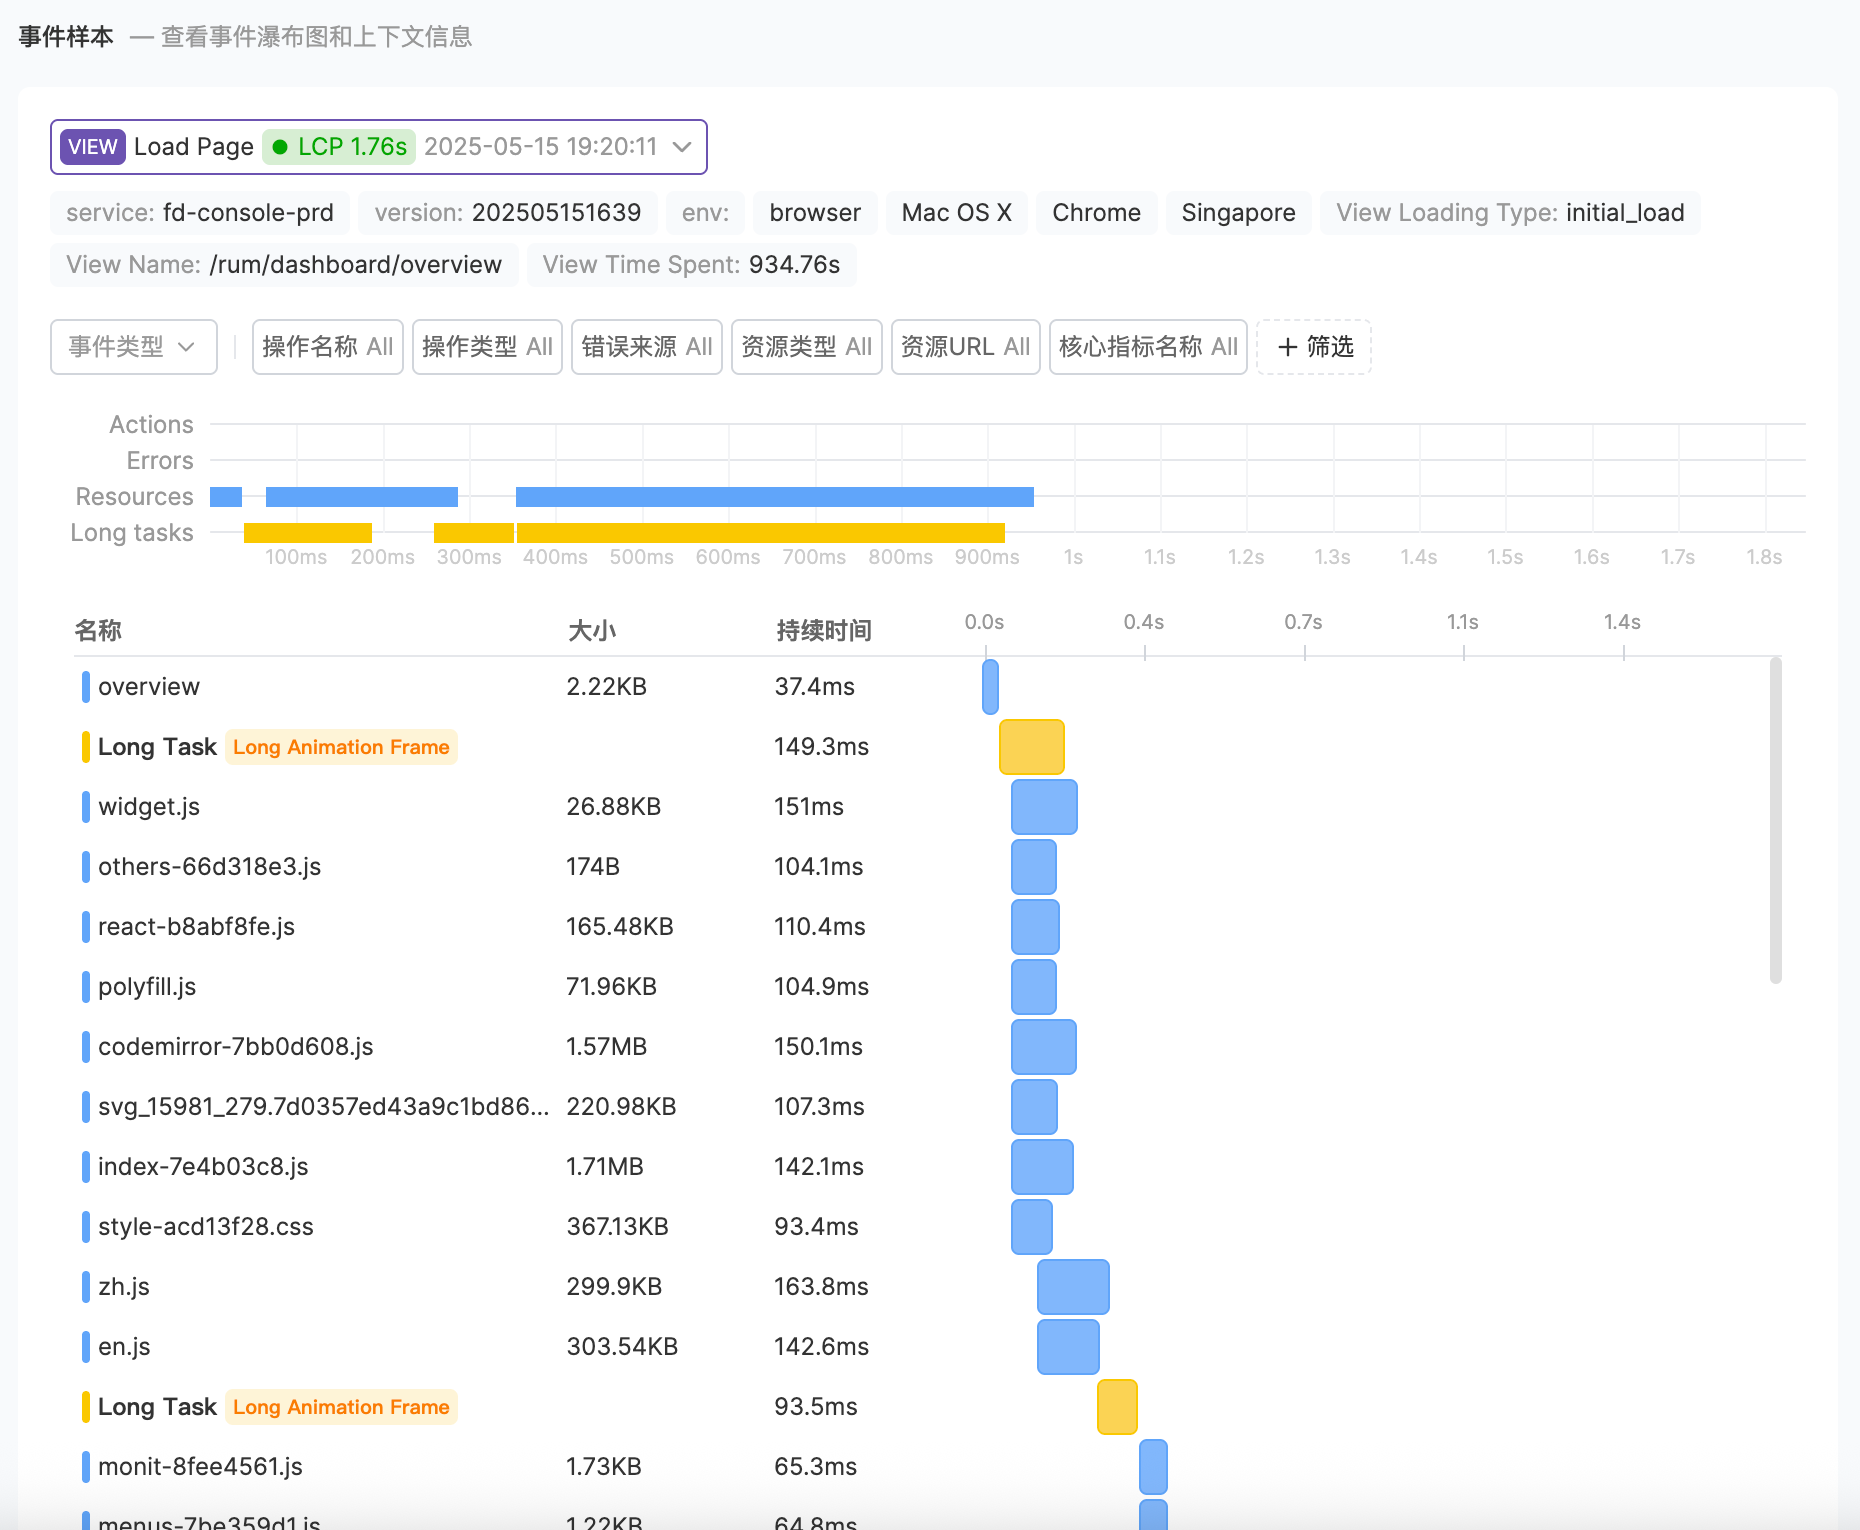
If you cannot locate key information more accurately during the resource analysis phase, you can select appropriate event samples in the event samples section for more detailed contextual analysis.
For example, for Largest Contentful Paint (LCP), you can view resources loaded before LCP was triggered. Since LCP is a metric for the time it takes for the largest element to load on the page, you can diagnose problems from both resource loading and error resolution perspectives.
If you cannot locate key information more accurately during the resource analysis phase, you can select appropriate event samples in the event samples section for more detailed contextual analysis.
 ## Optimization Directions
The resource loading analysis panel displays detailed loading information for all resources under the current view, helping you identify performance bottlenecks.
You can switch between two tabs to control the viewing scope:
* **All Resources**: Shows all resources loaded in the view
* **Blocking Resources**: Shows only resources marked as `blocking` render-blocking resources, which delay the page's first render
The resource list contains the following fields:
| Field | Description |
| ----------------- | ------------------------------------------------------------------------------------------------------------------------------------------------------- |
| URL GROUP | URL path group of the resource |
| TYPE | Resource type (such as JS, CSS, Image, etc.) |
| AVG CLIENT SIZE | Average client-side resource size |
| AVG TRANSFER SIZE | Average transfer size (if transfer size is significantly smaller than client size, it indicates some samples hit cache) |
| AVG START TIME | Average loading start time |
| AVG DURATION | Average loading duration, with a color bar visualizing the proportion of DNS resolution, connection establishment, first byte wait, and download phases |
Hover over the duration color bar to view the specific timing values for each phase, helping you determine whether slow loading is caused by network connection, server response, or resource size.
* Focus on recurring errors that may cause problems, as these anomalies also affect page performance
* The waterfall chart shows the timeline of events when the metric was captured
* Scroll down to view context for the rest of the page activity
* Use the dropdown in the upper left corner to select another sample event
* Click to expand any event in the waterfall to view the side panel
* Select appropriate event sets for problem analysis by filtering event types and various filter options
## Optimization Directions
The resource loading analysis panel displays detailed loading information for all resources under the current view, helping you identify performance bottlenecks.
You can switch between two tabs to control the viewing scope:
* **All Resources**: Shows all resources loaded in the view
* **Blocking Resources**: Shows only resources marked as `blocking` render-blocking resources, which delay the page's first render
The resource list contains the following fields:
| Field | Description |
| ----------------- | ------------------------------------------------------------------------------------------------------------------------------------------------------- |
| URL GROUP | URL path group of the resource |
| TYPE | Resource type (such as JS, CSS, Image, etc.) |
| AVG CLIENT SIZE | Average client-side resource size |
| AVG TRANSFER SIZE | Average transfer size (if transfer size is significantly smaller than client size, it indicates some samples hit cache) |
| AVG START TIME | Average loading start time |
| AVG DURATION | Average loading duration, with a color bar visualizing the proportion of DNS resolution, connection establishment, first byte wait, and download phases |
Hover over the duration color bar to view the specific timing values for each phase, helping you determine whether slow loading is caused by network connection, server response, or resource size.
* Focus on recurring errors that may cause problems, as these anomalies also affect page performance
* The waterfall chart shows the timeline of events when the metric was captured
* Scroll down to view context for the rest of the page activity
* Use the dropdown in the upper left corner to select another sample event
* Click to expand any event in the waterfall to view the side panel
* Select appropriate event sets for problem analysis by filtering event types and various filter options