> ## Documentation Index
> Fetch the complete documentation index at: https://docs.flashcat.cloud/llms.txt
> Use this file to discover all available pages before exploring further.
# Core Concepts
> Learn about the core concepts, key performance metrics, and calculation methods of Flashduty RUM performance monitoring to optimize user experience.
Flashduty RUM (Real User Monitoring) provides powerful tools to help you quickly diagnose and optimize frontend performance issues. Through the performance monitoring module, you can quickly identify performance bottlenecks, locate root causes, and implement optimization measures to ensure a smooth experience for users.
## Core Features
Automatically collect and analyze key performance metrics (such as FCP, LCP, CLS, FID, etc.), providing a comprehensive view of performance data
Monitor and analyze the loading performance of static resources (such as JS, CSS, images, etc.) to identify slow-loading resources
Track and analyze the performance of backend API calls, including response time, success rate, and other metrics
Provide comprehensive performance issue diagnosis capabilities, including performance bottleneck analysis and resource loading optimization suggestions
## Value and Benefits
| Benefit | Description |
| ---------------------------- | -------------------------------------------------------------------------------------------------- |
| **Improve User Experience** | Optimize website performance, reduce page load time, and improve user satisfaction |
| **Increase Conversion Rate** | Improve website performance to enhance user retention and conversion rates |
| **Data-Driven Decisions** | Make optimization decisions based on performance data and continuously improve product performance |
## Use Cases
Identify and resolve website performance bottlenecks to improve overall performance.
Analyze and optimize static resource loading to improve page load speed.
Monitor and optimize backend API performance to improve interface response speed.
Understand user experience through performance data and make targeted product improvements.
## Performance Monitoring Workflow
Flashduty RUM performance optimization consists of three key phases:
Quickly discovering performance problem trigger points is the first step in diagnosis. Flashduty RUM provides the following ways to help you identify problems:
* **Data Analysis**: View data trends of core performance metrics through the "Application Management - Data Analysis" module
* **User Feedback**: Discover potential problems through user reports (such as slow page loading or interaction lag)
* **Anomaly Detection**: Observe anomaly trends, such as increased resource loading failure rates or extended API response times
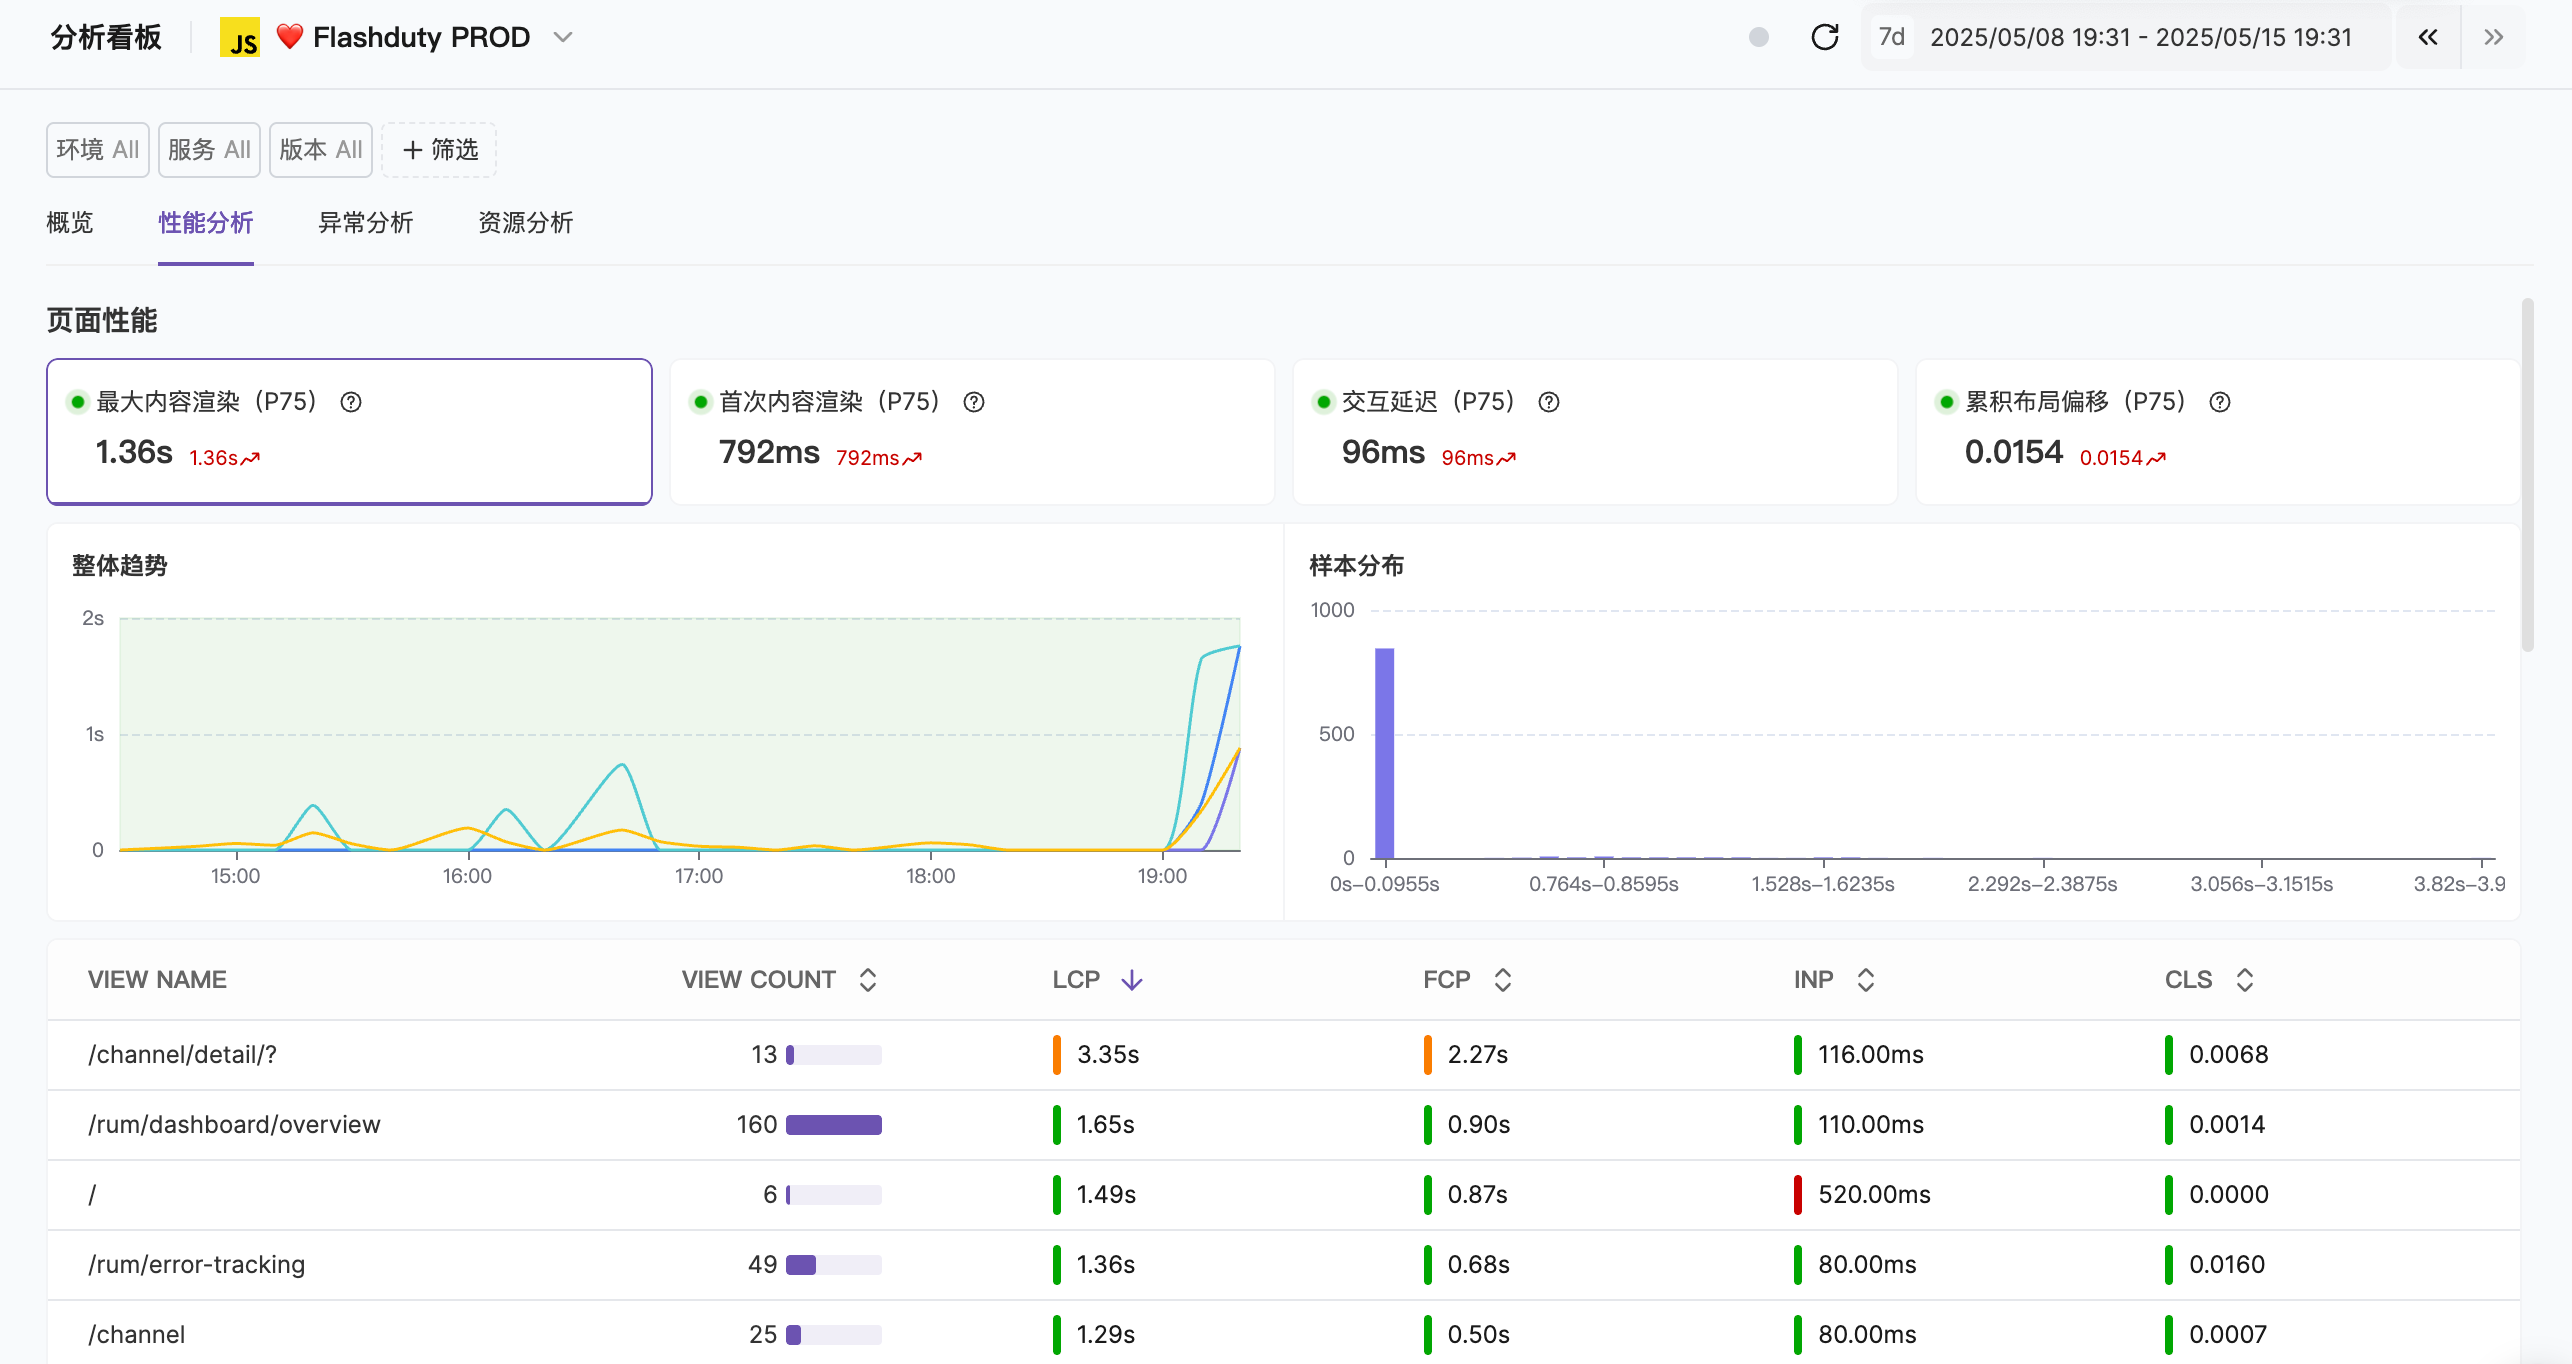 **Initial Assessment:**
* **Impact Scope**: Determine the user groups affected by the problem (e.g., specific regions, devices, or browsers)
* **Severity**: Assess the direct impact of the problem on user experience
* **Business Impact**: Analyze the impact of the problem on key business metrics (such as conversion rate or user retention)
Flashduty RUM provides rich performance data and contextual information:
**Core Performance Data:**
* **Page Loading Metrics**: Including LCP, FCP, TTI
* **Resource Loading Time**: Analyze loading time of images, scripts, CSS, and other resources
* **JavaScript Performance**: Monitor script execution time and render-blocking scripts
* **Network Requests**: Record API request latency, success rate, and error rate
**Contextual Information:**
* **User Environment**: Browser type, device model, operating system, and network conditions
* **Error Logs**: Capture detailed information about JavaScript errors, network errors, and resource loading failures
* **System Resources**: Analyze CPU usage, memory consumption, and DOM operation frequency
Through visualization tools and analysis features, classify performance problems and precisely locate root causes.
### Common Problem Classification
| Problem Type | Typical Symptoms | Possible Causes | Key Metrics |
| ------------------------------ | --------------------------------------------------- | --------------------------------------------------------------------------------- | ---------------------------------------- |
| **Slow Page Loading** | Long white screen time, slow first screen rendering | Large resource size, render-blocking scripts or CSS, slow server response | LCP, FCP, TTI |
| **Interaction Response Delay** | No response to clicks, laggy operations | Long JavaScript execution time, too many event listeners, frequent DOM operations | FID, INP, TBT |
| **Resource Loading Errors** | Image/script loading failure, timeout | CDN configuration errors, unstable network, incorrect resource paths | Resource loading time, failure rate |
| **JavaScript Errors** | Feature failure, console errors | Code logic errors, browser compatibility issues, memory leaks | Error rate, memory usage |
| **Network Connection Issues** | Request timeout, connection interruption | Slow API response, poor network quality, cross-origin configuration errors | Request latency, connection success rate |
## Problem Localization Tools
The performance waterfall chart displays the complete timeline of page loading, helping you identify bottlenecks.
**Initial Assessment:**
* **Impact Scope**: Determine the user groups affected by the problem (e.g., specific regions, devices, or browsers)
* **Severity**: Assess the direct impact of the problem on user experience
* **Business Impact**: Analyze the impact of the problem on key business metrics (such as conversion rate or user retention)
Flashduty RUM provides rich performance data and contextual information:
**Core Performance Data:**
* **Page Loading Metrics**: Including LCP, FCP, TTI
* **Resource Loading Time**: Analyze loading time of images, scripts, CSS, and other resources
* **JavaScript Performance**: Monitor script execution time and render-blocking scripts
* **Network Requests**: Record API request latency, success rate, and error rate
**Contextual Information:**
* **User Environment**: Browser type, device model, operating system, and network conditions
* **Error Logs**: Capture detailed information about JavaScript errors, network errors, and resource loading failures
* **System Resources**: Analyze CPU usage, memory consumption, and DOM operation frequency
Through visualization tools and analysis features, classify performance problems and precisely locate root causes.
### Common Problem Classification
| Problem Type | Typical Symptoms | Possible Causes | Key Metrics |
| ------------------------------ | --------------------------------------------------- | --------------------------------------------------------------------------------- | ---------------------------------------- |
| **Slow Page Loading** | Long white screen time, slow first screen rendering | Large resource size, render-blocking scripts or CSS, slow server response | LCP, FCP, TTI |
| **Interaction Response Delay** | No response to clicks, laggy operations | Long JavaScript execution time, too many event listeners, frequent DOM operations | FID, INP, TBT |
| **Resource Loading Errors** | Image/script loading failure, timeout | CDN configuration errors, unstable network, incorrect resource paths | Resource loading time, failure rate |
| **JavaScript Errors** | Feature failure, console errors | Code logic errors, browser compatibility issues, memory leaks | Error rate, memory usage |
| **Network Connection Issues** | Request timeout, connection interruption | Slow API response, poor network quality, cross-origin configuration errors | Request latency, connection success rate |
## Problem Localization Tools
The performance waterfall chart displays the complete timeline of page loading, helping you identify bottlenecks.
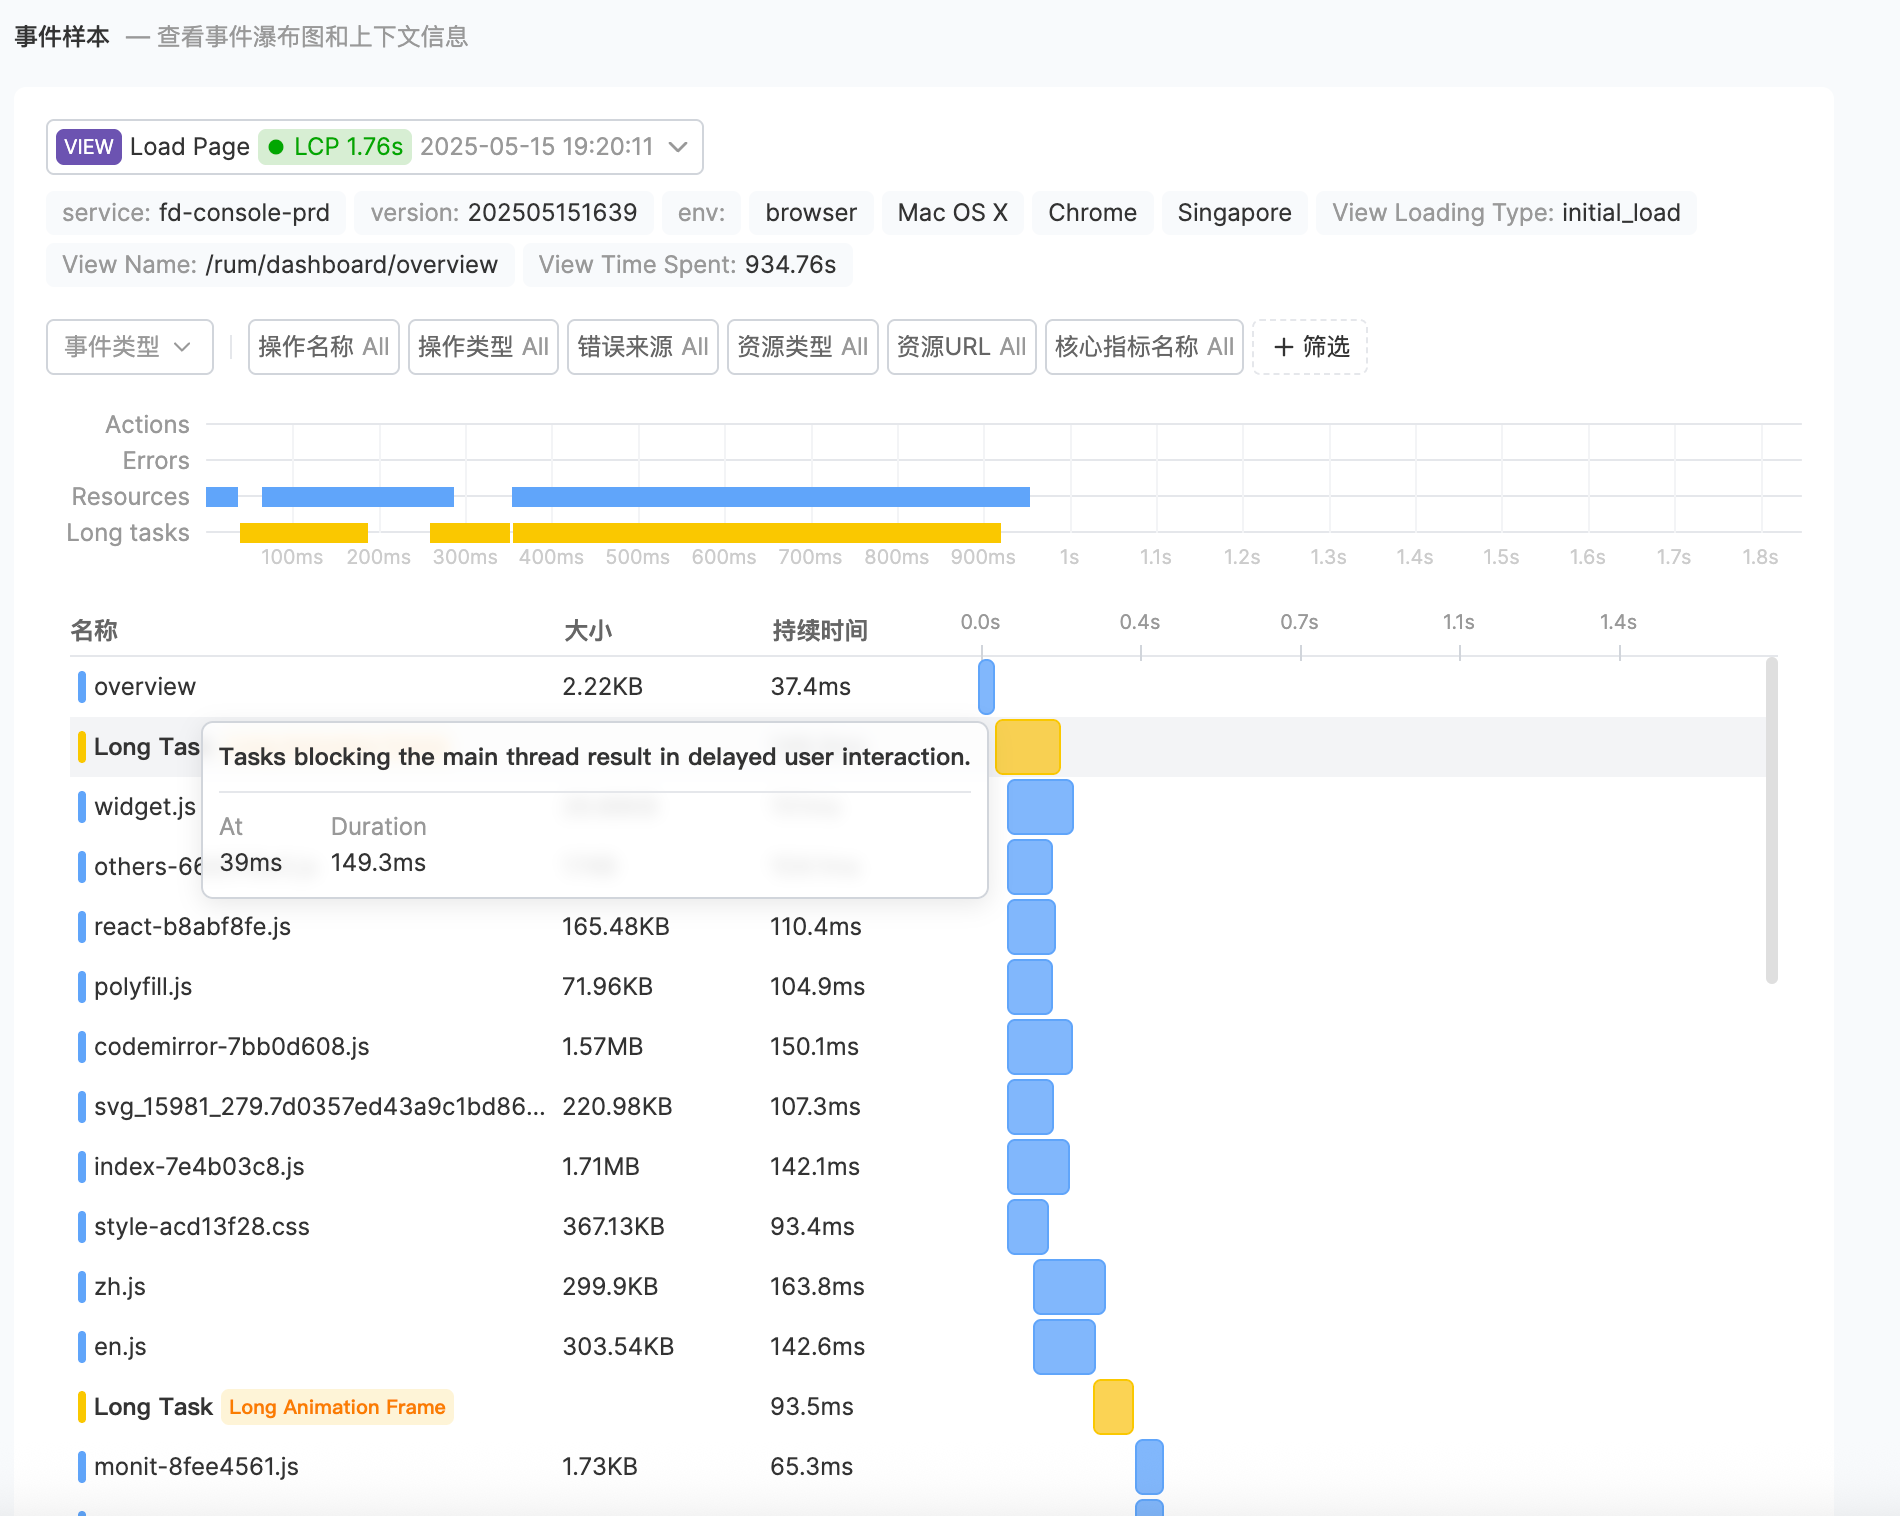 **Key Time Points:**
* **Navigation Start**: Time when user initiates page request
* **DNS Lookup**: Domain name resolution time
* **TCP Connection**: Time to establish server connection
* **Time to First Byte (TTFB)**: Time to receive the first byte of server response
* **DOM Complete**: Time when page DOM structure is fully loaded
**Resource Loading Analysis:**
* **Critical Path**: Identify critical resources affecting page rendering
* **Blocking Resources**: Discover scripts or stylesheets blocking rendering
* **Loading Order**: Optimize resource loading priority
* **Resource Size**: Check for oversized resources
Flashduty RUM captures and categorizes frontend errors, providing detailed contextual information.
**Error Types:**
* JavaScript runtime errors (such as uncaught exceptions or syntax errors)
* Network request errors (such as API timeouts or 4xx/5xx errors)
* Resource loading errors (such as image or script loading failures)
* Framework-related errors (such as React or Vue component rendering errors)
**Error Context:**
* **Error Stack**: Provides detailed call stack information
* **User Action Sequence**: Reproduce the operation path that triggered the error
* **Environment Information**: Includes browser, device, and network status
* **Related Performance Data**: Correlate errors with performance metric changes
## Optimization Suggestions
After locating the root cause, you can implement optimizations based on the analysis results:
Compress resources, optimize critical CSS, enable CDN
Reduce JavaScript execution time, optimize event listeners
Check CDN configuration, ensure correct resource paths
Fix code logic, add error boundaries, optimize memory usage
## Next Steps
Learn about metrics collection and reporting mechanisms
Deep dive into performance data analysis
Learn problem diagnosis and optimization methods
**Key Time Points:**
* **Navigation Start**: Time when user initiates page request
* **DNS Lookup**: Domain name resolution time
* **TCP Connection**: Time to establish server connection
* **Time to First Byte (TTFB)**: Time to receive the first byte of server response
* **DOM Complete**: Time when page DOM structure is fully loaded
**Resource Loading Analysis:**
* **Critical Path**: Identify critical resources affecting page rendering
* **Blocking Resources**: Discover scripts or stylesheets blocking rendering
* **Loading Order**: Optimize resource loading priority
* **Resource Size**: Check for oversized resources
Flashduty RUM captures and categorizes frontend errors, providing detailed contextual information.
**Error Types:**
* JavaScript runtime errors (such as uncaught exceptions or syntax errors)
* Network request errors (such as API timeouts or 4xx/5xx errors)
* Resource loading errors (such as image or script loading failures)
* Framework-related errors (such as React or Vue component rendering errors)
**Error Context:**
* **Error Stack**: Provides detailed call stack information
* **User Action Sequence**: Reproduce the operation path that triggered the error
* **Environment Information**: Includes browser, device, and network status
* **Related Performance Data**: Correlate errors with performance metric changes
## Optimization Suggestions
After locating the root cause, you can implement optimizations based on the analysis results:
Compress resources, optimize critical CSS, enable CDN
Reduce JavaScript execution time, optimize event listeners
Check CDN configuration, ensure correct resource paths
Fix code logic, add error boundaries, optimize memory usage
## Next Steps
Learn about metrics collection and reporting mechanisms
Deep dive into performance data analysis
Learn problem diagnosis and optimization methods