> ## Documentation Index
> Fetch the complete documentation index at: https://docs.flashcat.cloud/llms.txt
> Use this file to discover all available pages before exploring further.
# Replay Records
> Master Flashduty RUM's session replay feature to quickly locate issues and optimize user experience by recreating user operation paths.
Flashduty RUM's session replay feature helps developers quickly locate issues, analyze user behavior, and optimize product experience by intuitively recreating user operation paths. Integrated into the RUM SDK, it can be enabled with simple configuration, supporting flexible sampling strategies and privacy rule settings.
## Session List
In the "Session Replay" menu, you can view recent session records, sorted by time in descending order by default.
**Supported Features:**
* Sort by session duration, view count, action count, exception count, and other fields
* Rich filter conditions (such as time range, page, tags, etc.)
Click on any record to open the player panel:
| Area | Description |
| ---------------------------- | ------------------------------------------------------------------------------------------ |
| **Information Display Area** | Shows session visit time, start and end pages, tags, and other contextual information |
| **Playback Area** | Recreates operation path from user's perspective, clearly showing user interaction details |
| **Playback Control Area** | Provides playback control functions for easy operation |
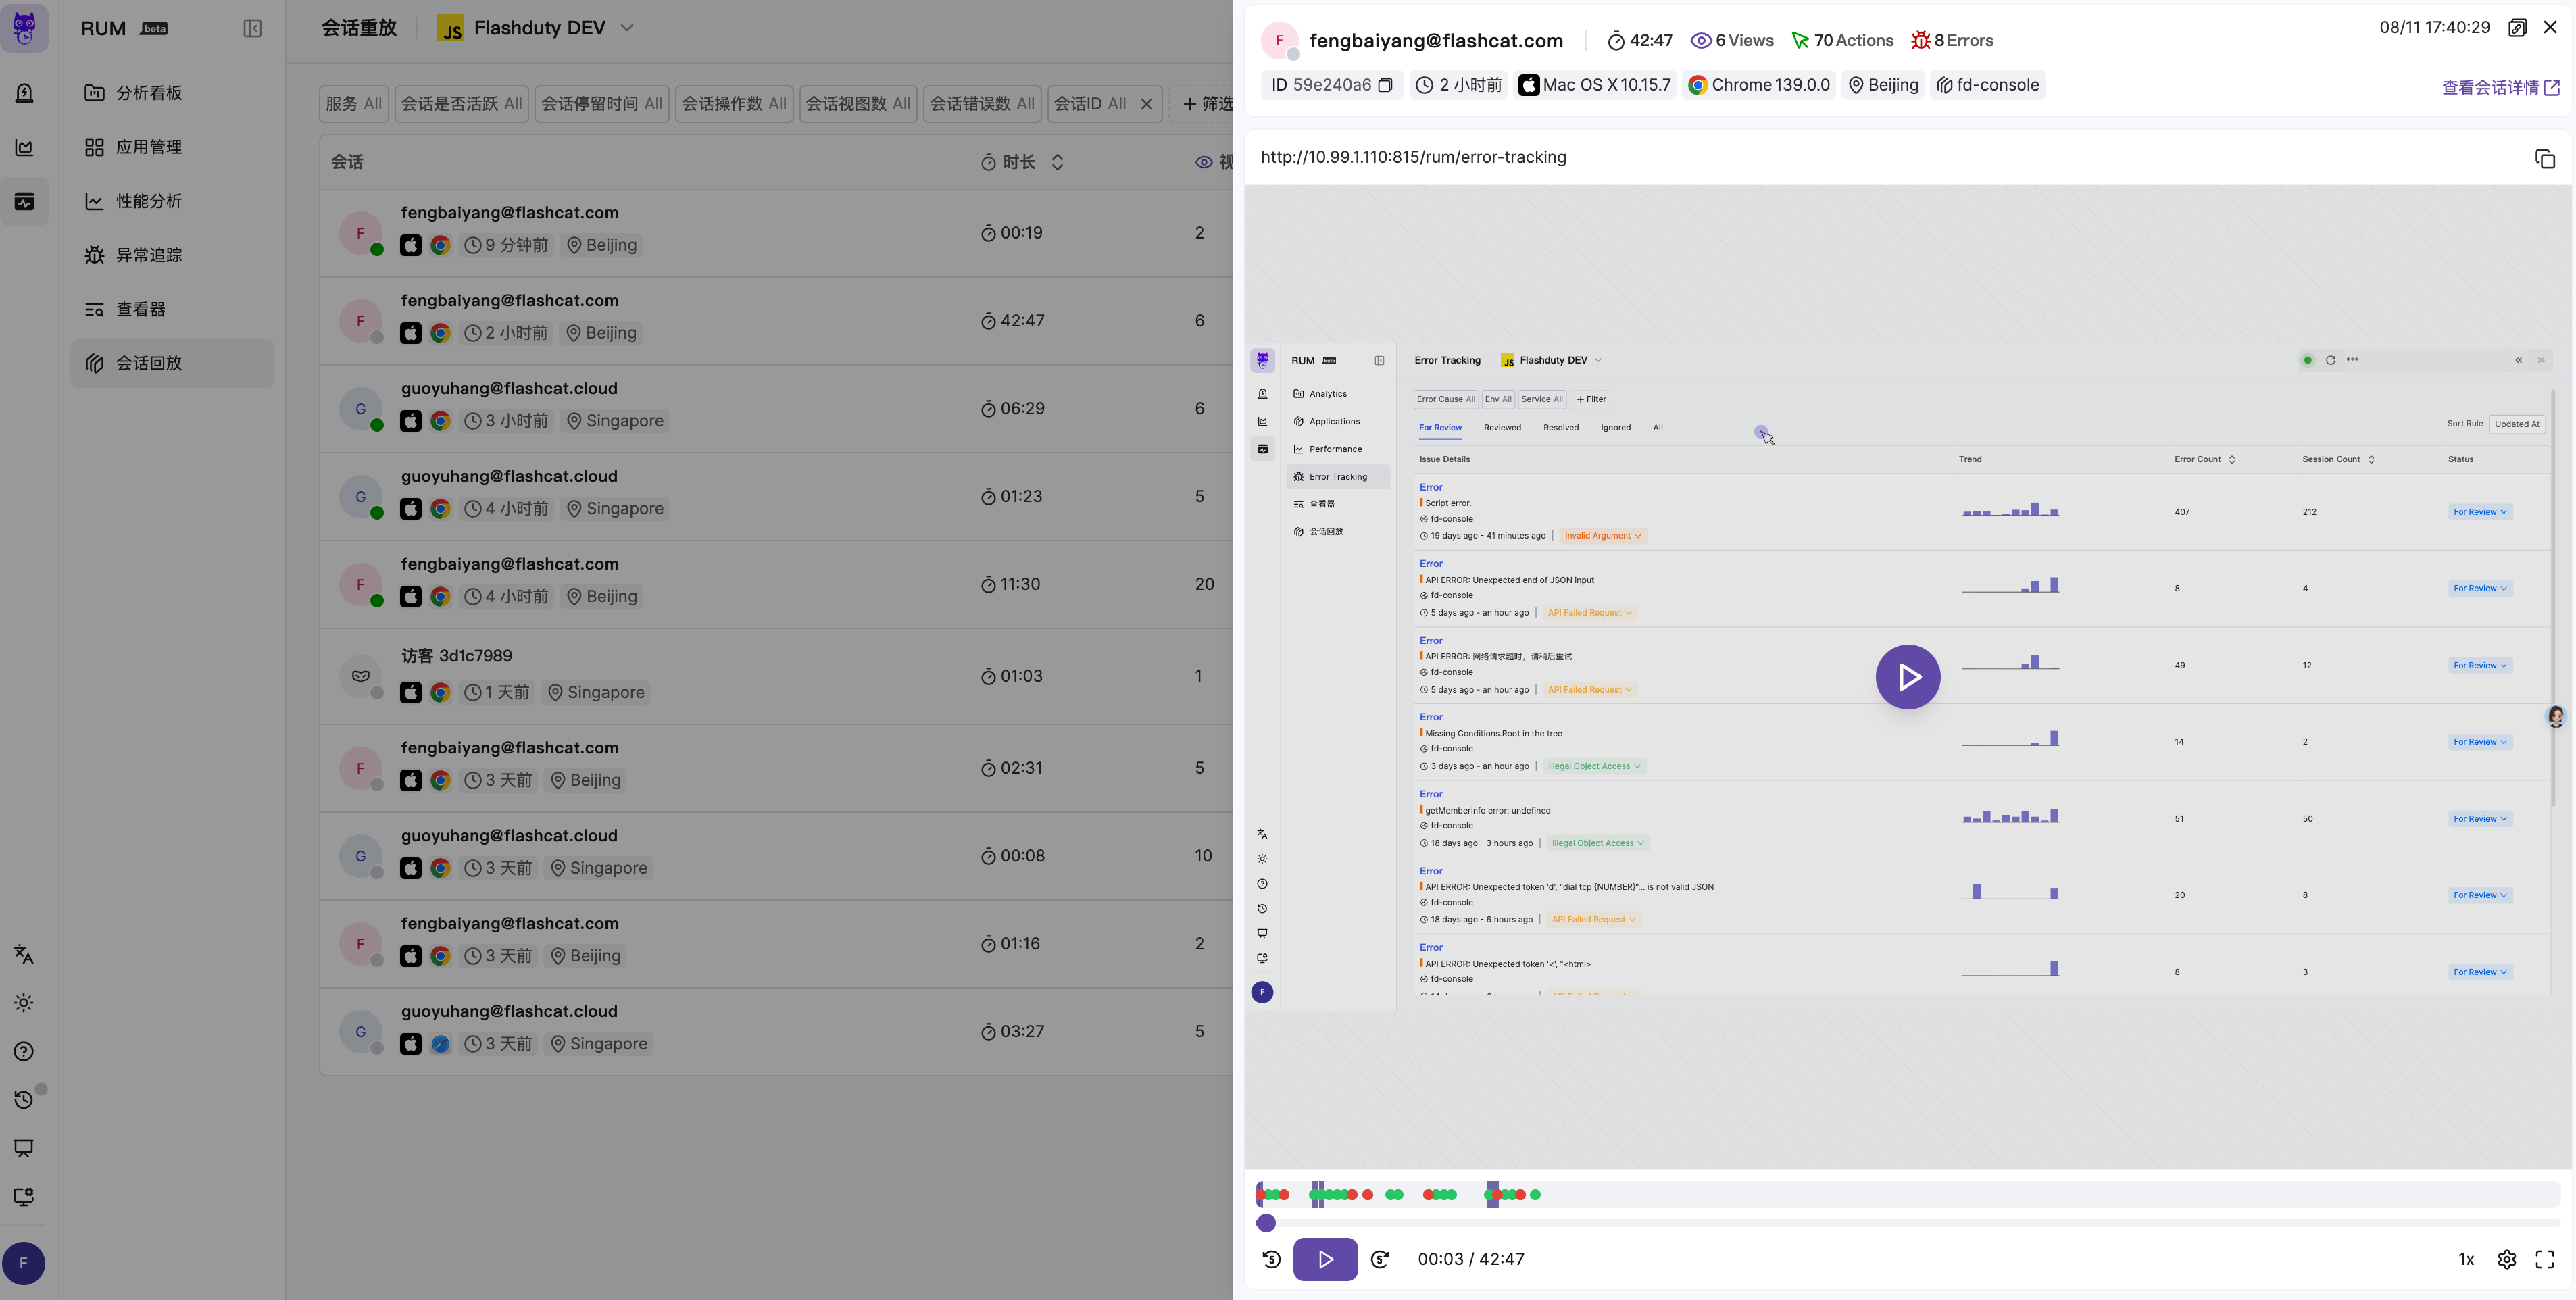 For quick browsing, only replays with duration **greater than 3 seconds** are shown in the list.
## Player
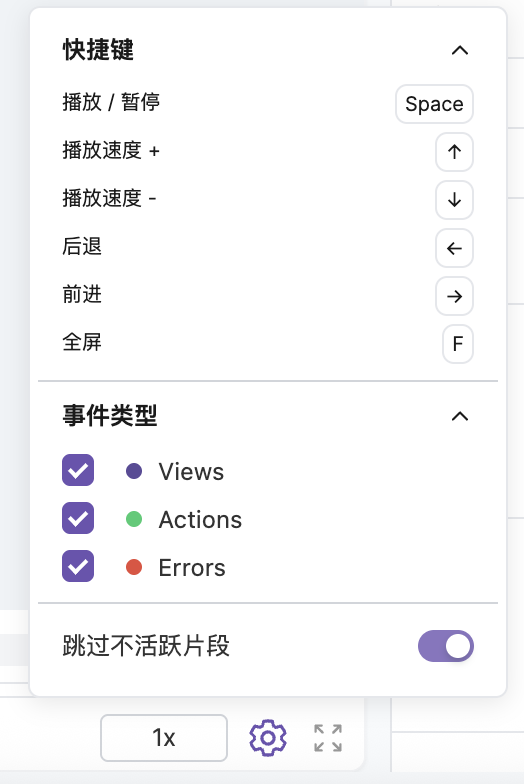
The player supports play, pause, fast forward, rewind, replay, speed control, fullscreen, and seek functions, with keyboard shortcut support to improve efficiency.
For quick browsing, only replays with duration **greater than 3 seconds** are shown in the list.
## Player
The player supports play, pause, fast forward, rewind, replay, speed control, fullscreen, and seek functions, with keyboard shortcut support to improve efficiency.
 During playback, the timeline marks user actions (Action) and exceptions (Error) with different colored icons, allowing quick overview of key events in the session.
By default, the player automatically skips inactive segments to improve viewing efficiency. You can also disable this feature through configuration to play completely in actual time sequence.
During playback, the timeline marks user actions (Action) and exceptions (Error) with different colored icons, allowing quick overview of key events in the session.
By default, the player automatically skips inactive segments to improve viewing efficiency. You can also disable this feature through configuration to play completely in actual time sequence.
 ## Devtools
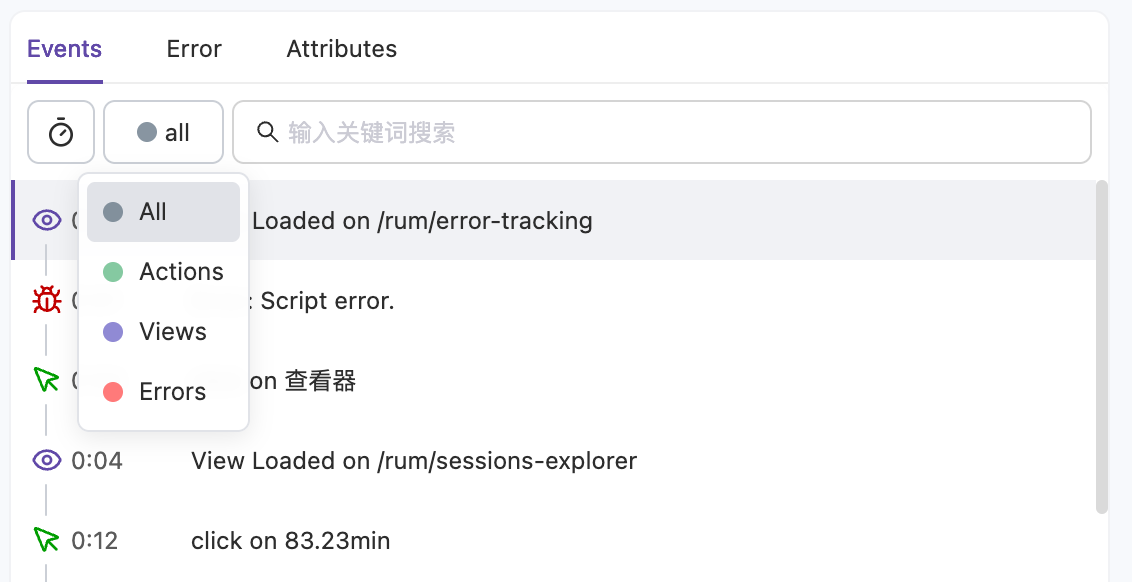
Through the "View All Events and Exceptions" feature, you can enter widescreen mode to view the session's operation timeline and detailed analysis.
Shows all user operations in the session, supporting the following features:
* Toggle between relative time and absolute time display
* Filter by event type (such as clicks, page navigation, etc.)
* Click on a specific event, and the player will automatically jump to the corresponding timestamp
## Devtools
Through the "View All Events and Exceptions" feature, you can enter widescreen mode to view the session's operation timeline and detailed analysis.
Shows all user operations in the session, supporting the following features:
* Toggle between relative time and absolute time display
* Filter by event type (such as clicks, page navigation, etc.)
* Click on a specific event, and the player will automatically jump to the corresponding timestamp
 Lists all exceptions and issues in the session, supporting click-through to detailed error information for quick identification and analysis.
Displays detailed information about all network requests during the session, helping you analyze resource loading and API call behavior.
**Supported Features:**
* Filter by resource type: XHR and Fetch requests are selected by default, but you can also view Image, JS, CSS, Font, Document, Media, and other static resource types
* Toggle between relative time and absolute time display
* Search request records by status code or URL. Status code search supports advanced syntax, for example `200` (match successful requests), `-200` (exclude 200), `>=400` (match error requests), and multi-condition combinations (such as `-200 -202`)
* Click any request record to open the resource detail sidebar with complete timing information
Each request record displays the following fields:
| Field | Description |
| ----------- | --------------------------------------- |
| Time | When the request occurred |
| Status Code | HTTP response status code |
| Type | Resource type (XHR, Fetch, Image, etc.) |
| Method | HTTP request method (GET, POST, etc.) |
| URL | Full request address |
| Size | Response body size |
Shows session contextual information (such as device, browser, geographic location, etc.), helping developers gain deep understanding of the problem background for precise identification.
## Next Steps
Learn about privacy protection settings
Lists all exceptions and issues in the session, supporting click-through to detailed error information for quick identification and analysis.
Displays detailed information about all network requests during the session, helping you analyze resource loading and API call behavior.
**Supported Features:**
* Filter by resource type: XHR and Fetch requests are selected by default, but you can also view Image, JS, CSS, Font, Document, Media, and other static resource types
* Toggle between relative time and absolute time display
* Search request records by status code or URL. Status code search supports advanced syntax, for example `200` (match successful requests), `-200` (exclude 200), `>=400` (match error requests), and multi-condition combinations (such as `-200 -202`)
* Click any request record to open the resource detail sidebar with complete timing information
Each request record displays the following fields:
| Field | Description |
| ----------- | --------------------------------------- |
| Time | When the request occurred |
| Status Code | HTTP response status code |
| Type | Resource type (XHR, Fetch, Image, etc.) |
| Method | HTTP request method (GET, POST, etc.) |
| URL | Full request address |
| Size | Response body size |
Shows session contextual information (such as device, browser, geographic location, etc.), helping developers gain deep understanding of the problem background for precise identification.
## Next Steps
Learn about privacy protection settings