Core Concepts
Loki’s query language LogQL is divided into two types:| Type | Description |
|---|---|
| Log Queries | Returns log line content (Stream) |
| Metric Queries | Counts or aggregates logs, like count_over_time returns values (Vector) |
1. Threshold Evaluation Mode
This mode is suitable for scenarios requiring multi-level threshold evaluation on log aggregate values (e.g., Info/Warning/Critical).Configuration
- Query Statement (LogQL): Write LogQL that returns numeric vectors (select “Do Stats” query mode)
error keyword in mysql job in the last 5 minutes:
- Threshold Conditions:
- Critical:
$A > 50(Error logs exceed 50 in 5 minutes) - Warning:
$A > 10(Error logs exceed 10 in 5 minutes)
- Critical:
How It Works
The engine executes LogQL query and gets time series data with labels (Vector). The engine iterates through each series, extracting values to compare against configured threshold expressions.Recovery Logic
| Strategy | Description |
|---|---|
| Auto Recovery | When query result value falls below threshold, automatically recovers |
| Specific Recovery Condition | Configurable like $A < 5 to avoid oscillation near threshold |
| Recovery Query | Supports independent LogQL for recovery evaluation |
2. Data Exists Mode
This mode is suitable for users who prefer writing filter conditions directly in LogQL, or scenarios that only care about “whether anomalous data exists”. Recommended for log anomaly detection alerts.Configuration
- Query Statement (LogQL): Write LogQL containing comparison operators, returning only data satisfying conditions
- Evaluation Rules: As long as LogQL query returns data, triggers alert
Pros and Cons Analysis
| Type | Description |
|---|---|
| Pros | Computation logic pushed down to Loki server, reducing data transmission |
| Cons | Cannot differentiate alert levels; can only trigger single-level alerts |
Recovery Logic
- Recovery When Data Disappears: When LogQL query result is empty, determines recovery
- Recovery Query: Supports configuring additional query statements to assist in determining recovery status
3. No Data Mode
This mode is used to monitor whether log reporting pipeline is interrupted, or whether logs that should be continuously generated have stopped.Configuration
- Query Statement (LogQL): Write a query that is expected to always have data
- Evaluation Rules: If a Series (uniquely identified by labels, like
instance="host-1") existed in previous cycles but cannot be found in current and N consecutive cycles, triggers “No Data” alert
Typical Applications
- Monitor whether Promtail/Fluentd and other collection Agents have stopped working
- Monitor whether critical business logs (like order creation logs) are abnormally interrupted
4. Getting Original Logs During Alert
Original logs can be obtained through related queries during alerts. But typically not recommended to get too many; just get 1 as a log sample to include in alert message.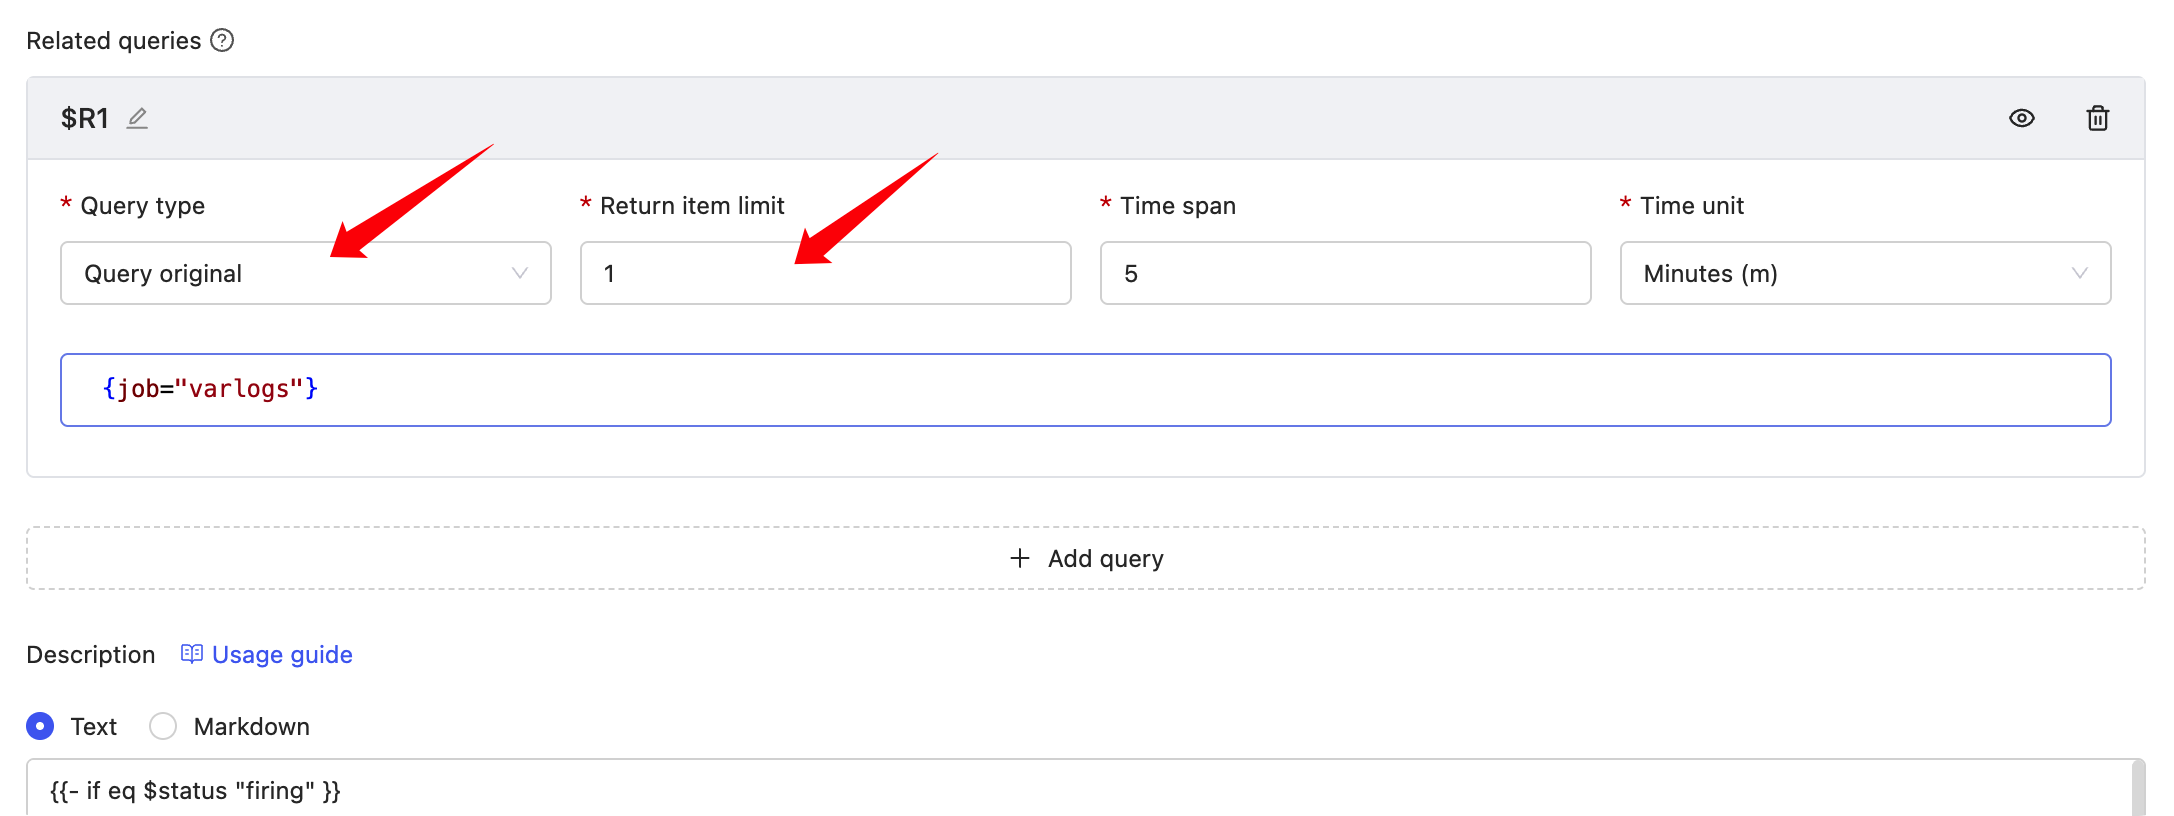 Related query results can be rendered in “Notes Description”, example: