Overview
Flashduty RUM Insights dashboard provides out-of-the-box visualization dashboards that automatically collect and analyze multi-dimensional data including user sessions, performance, resources, and errors. This helps you gain comprehensive insights into your application’s real-world performance, quickly identify performance bottlenecks and issues, and continuously optimize user experience. The Insights dashboard includes four main analysis dimensions:Overview
Key metrics at a glance
Performance Analysis
Comprehensive application experience monitoring
Error Analysis
Quick error identification and diagnosis
Resource Analysis
Fine-grained resource optimization
Overview
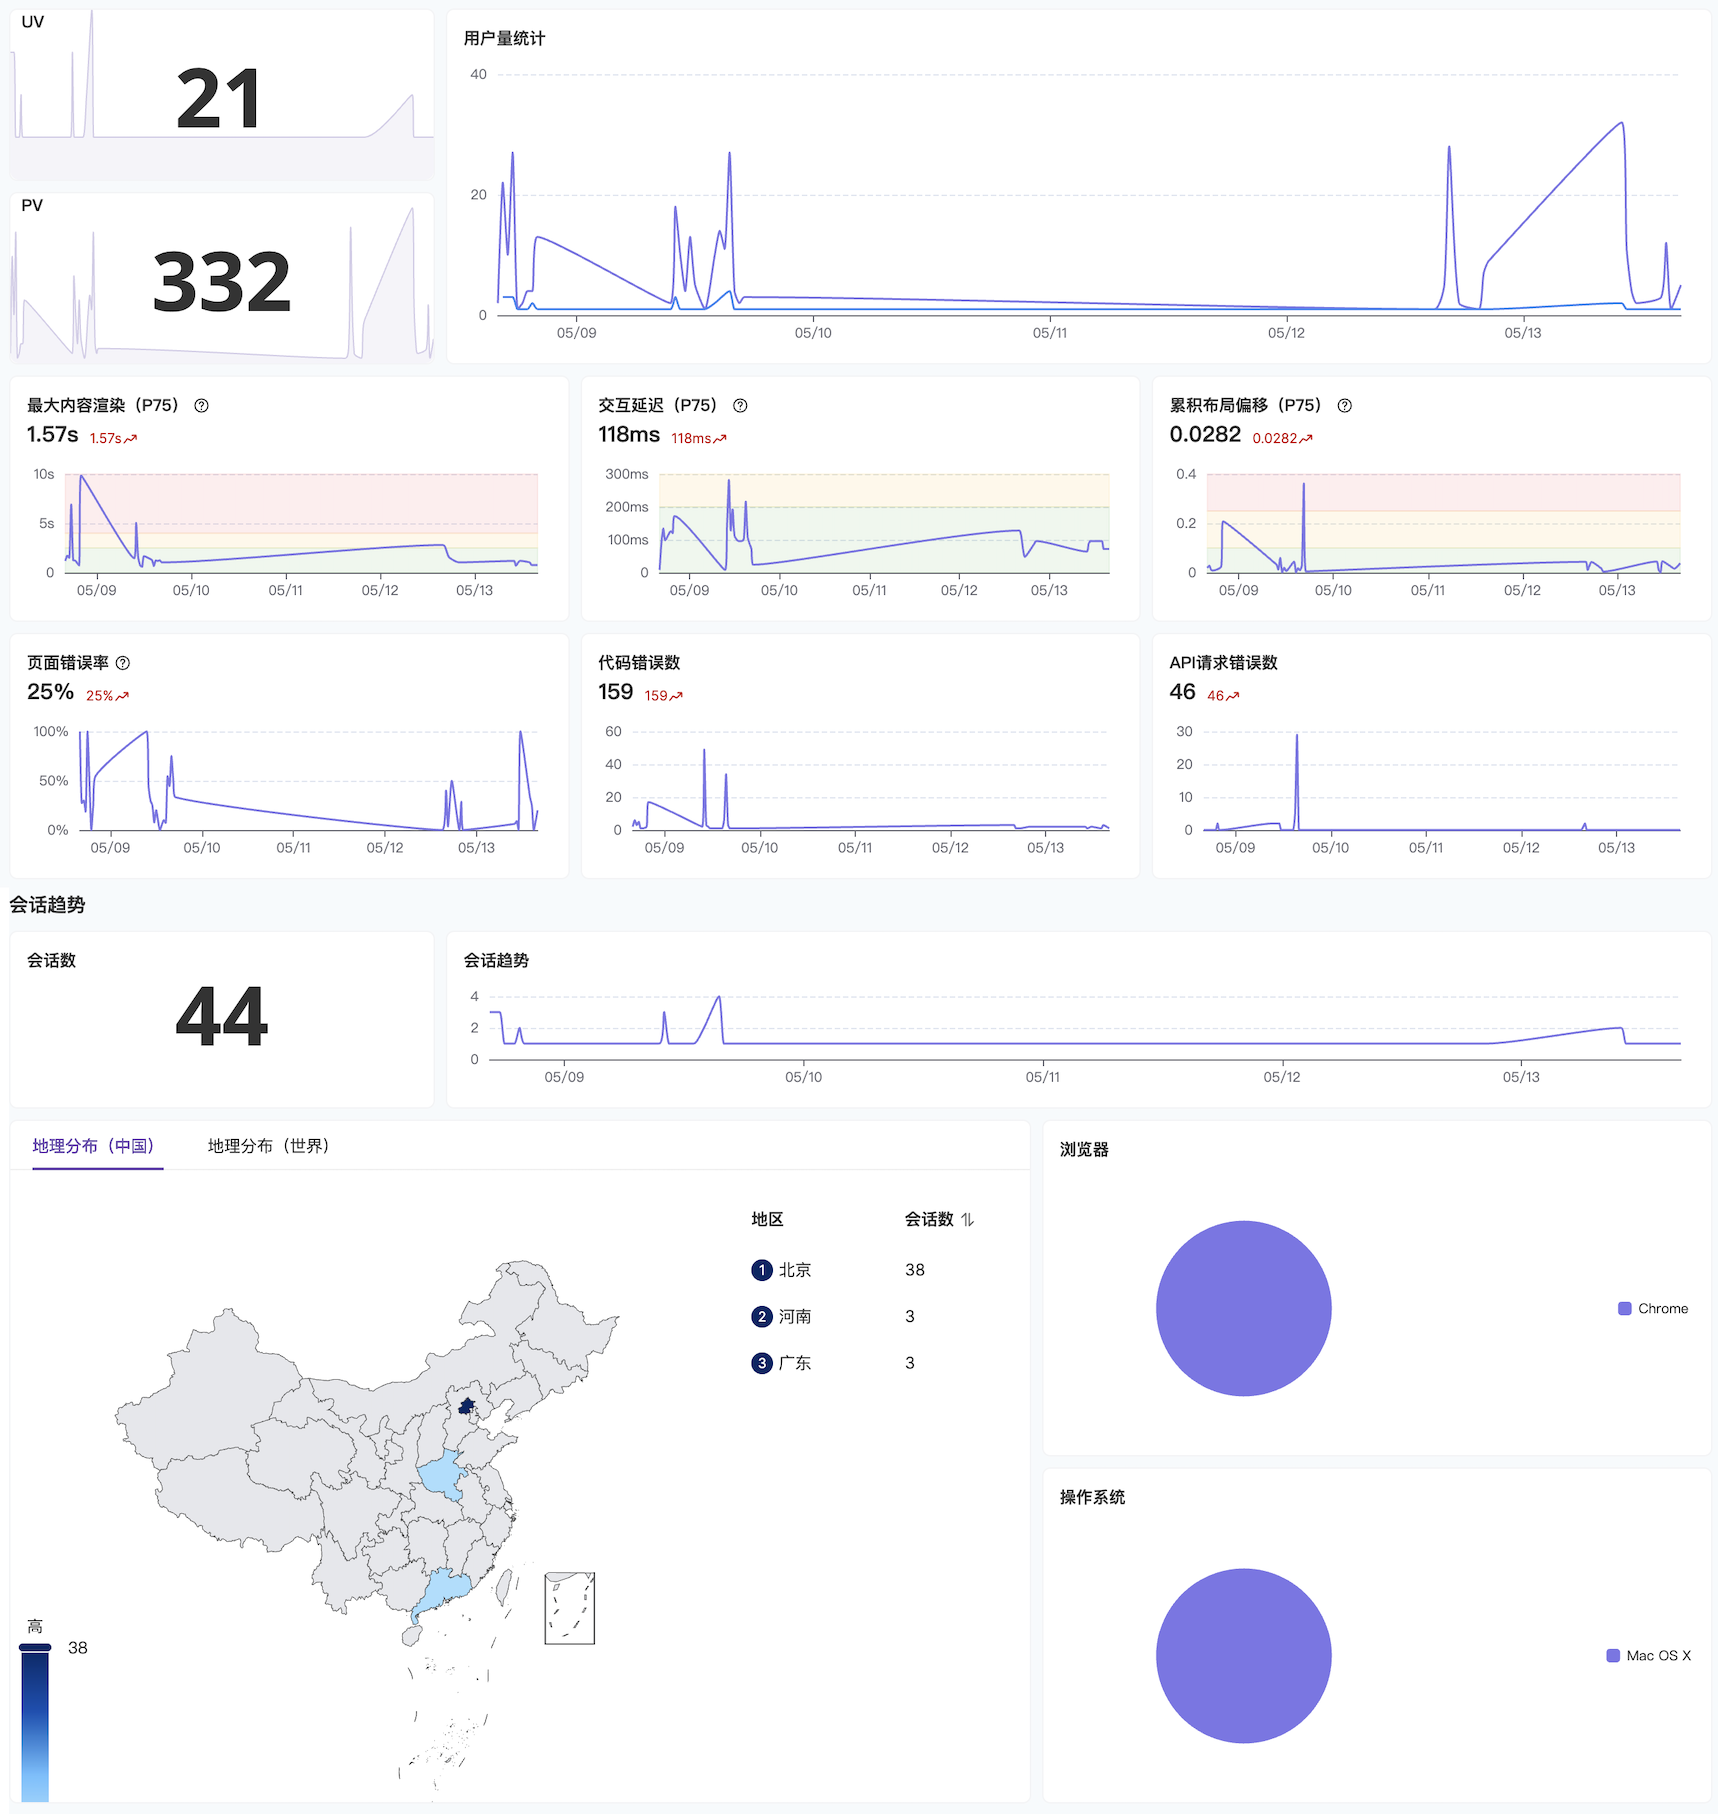
| Metric Type | Description |
|---|---|
| Traffic Metrics | Monitor PV (Page Views), UV (Unique Visitors), and sessions to understand overall traffic trends |
| User Distribution | Gain insights into user sources and active regions based on geographic location and device types |
| Health & Performance Metrics | Display Core Web Vitals: LCP (Largest Contentful Paint), FID (First Input Delay), CLS (Cumulative Layout Shift) |
| Errors & Exceptions | Track error rates by type to quickly identify potential risk areas |
Performance Analysis
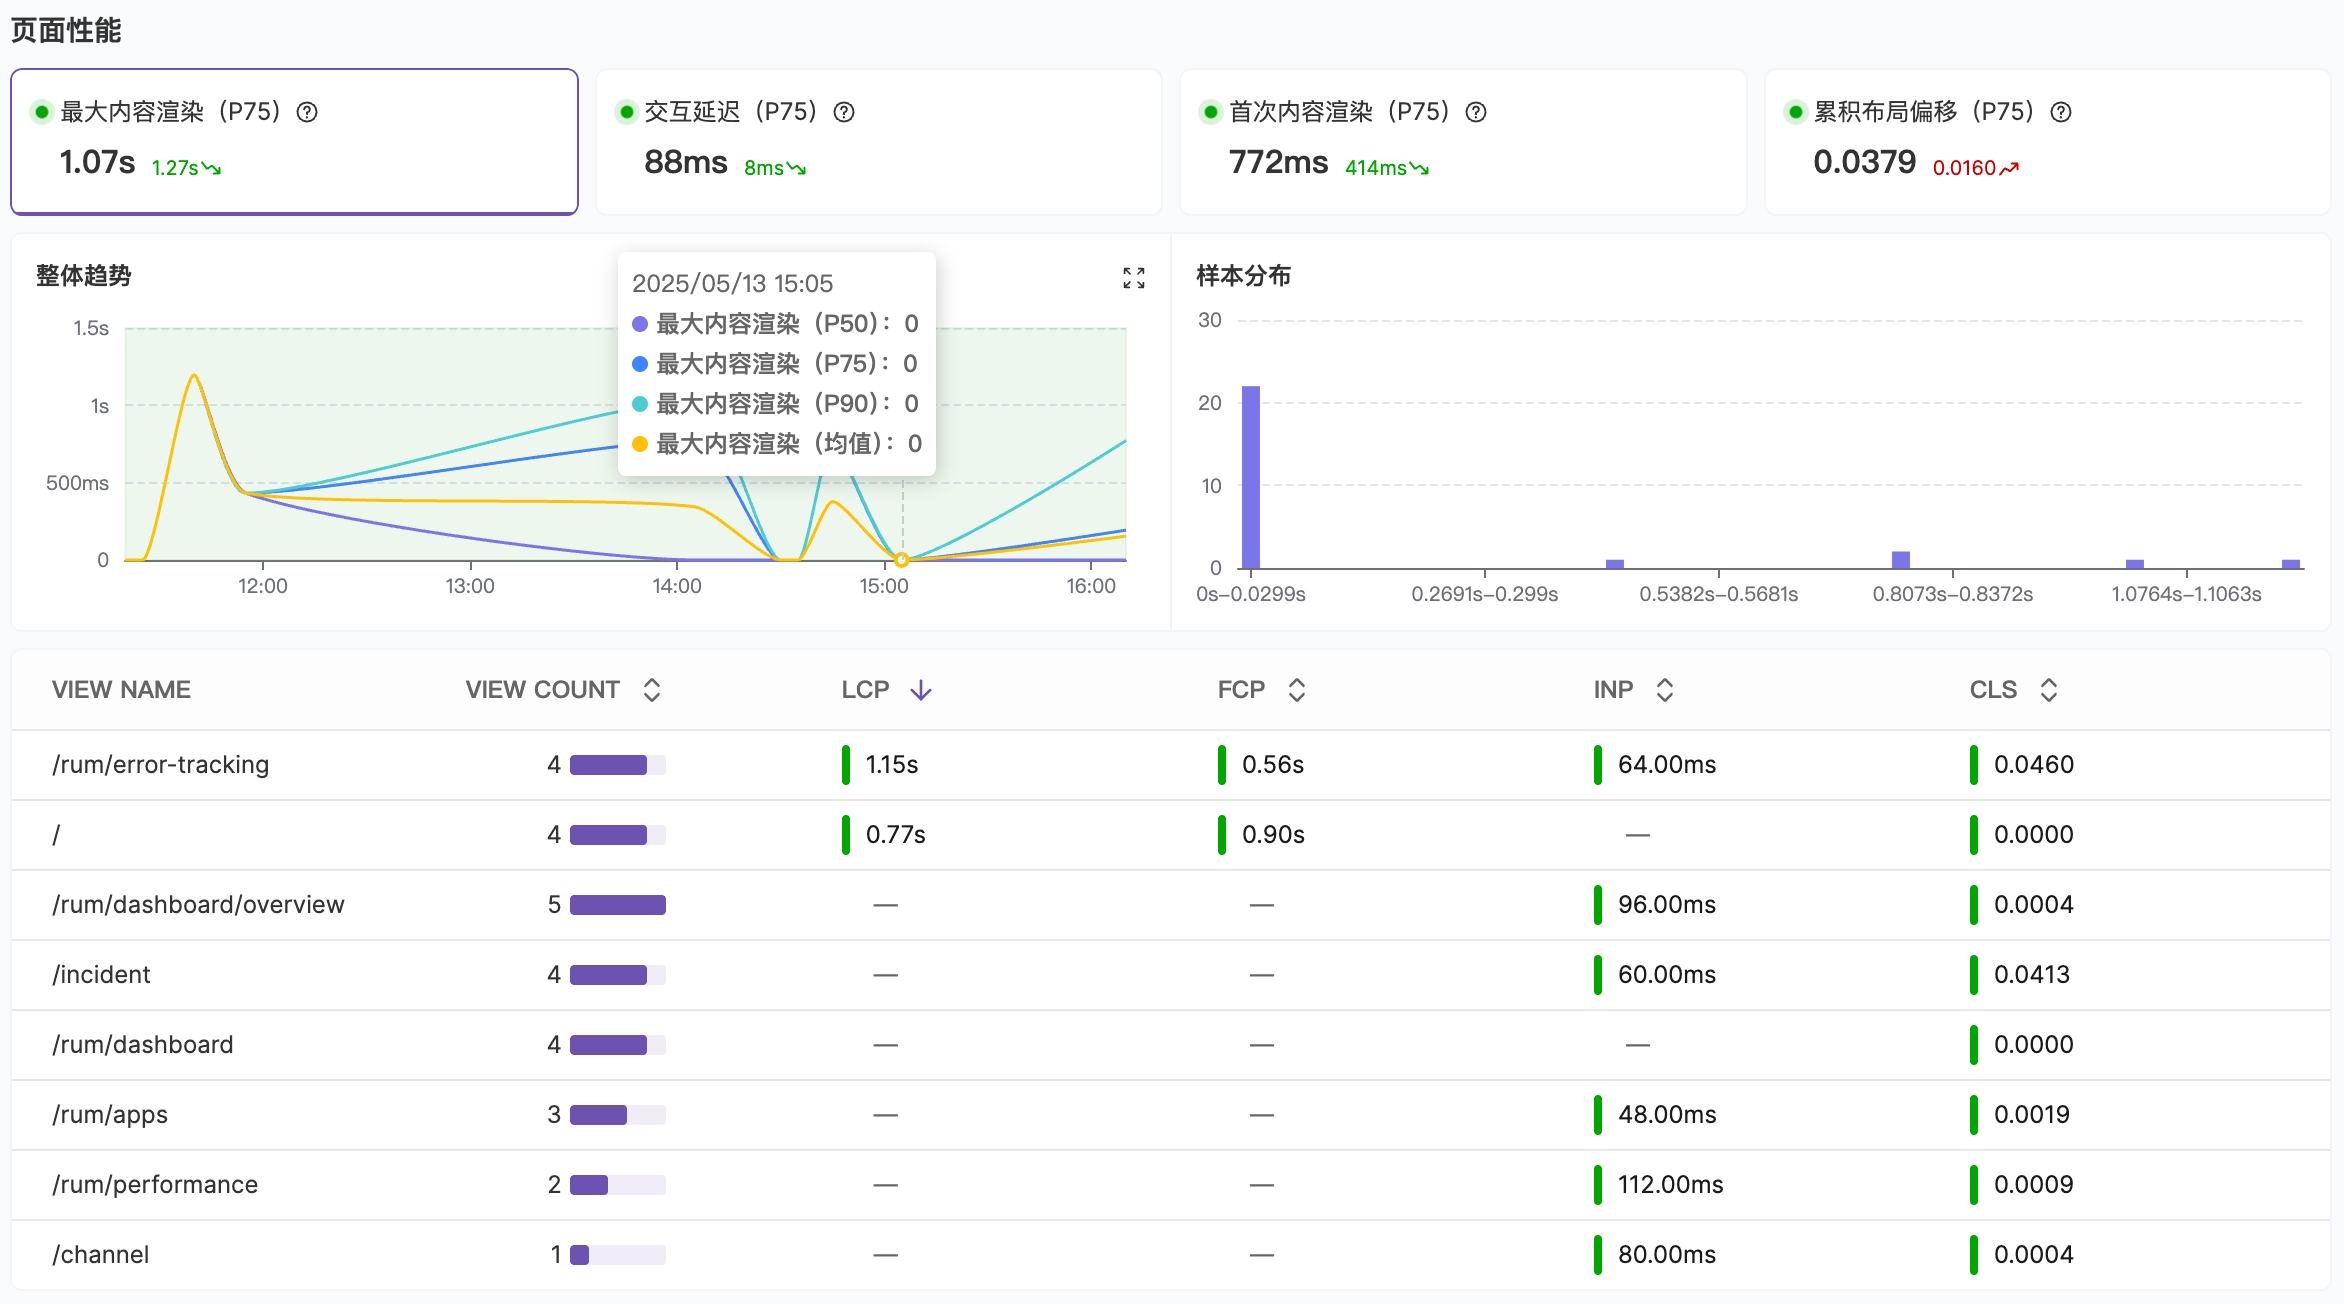
- Page Performance: Monitor trends and sample distribution of core page loading metrics like FCP, LCP, and CLS
- Long Tasks: Long Animation Frames where rendering updates are delayed beyond 50 milliseconds
- XHR and Fetch Requests: Analyze API loading performance to identify slow endpoints
- Static Resources: Analyze static resource loading times to identify performance bottlenecks during application loading
Error Analysis
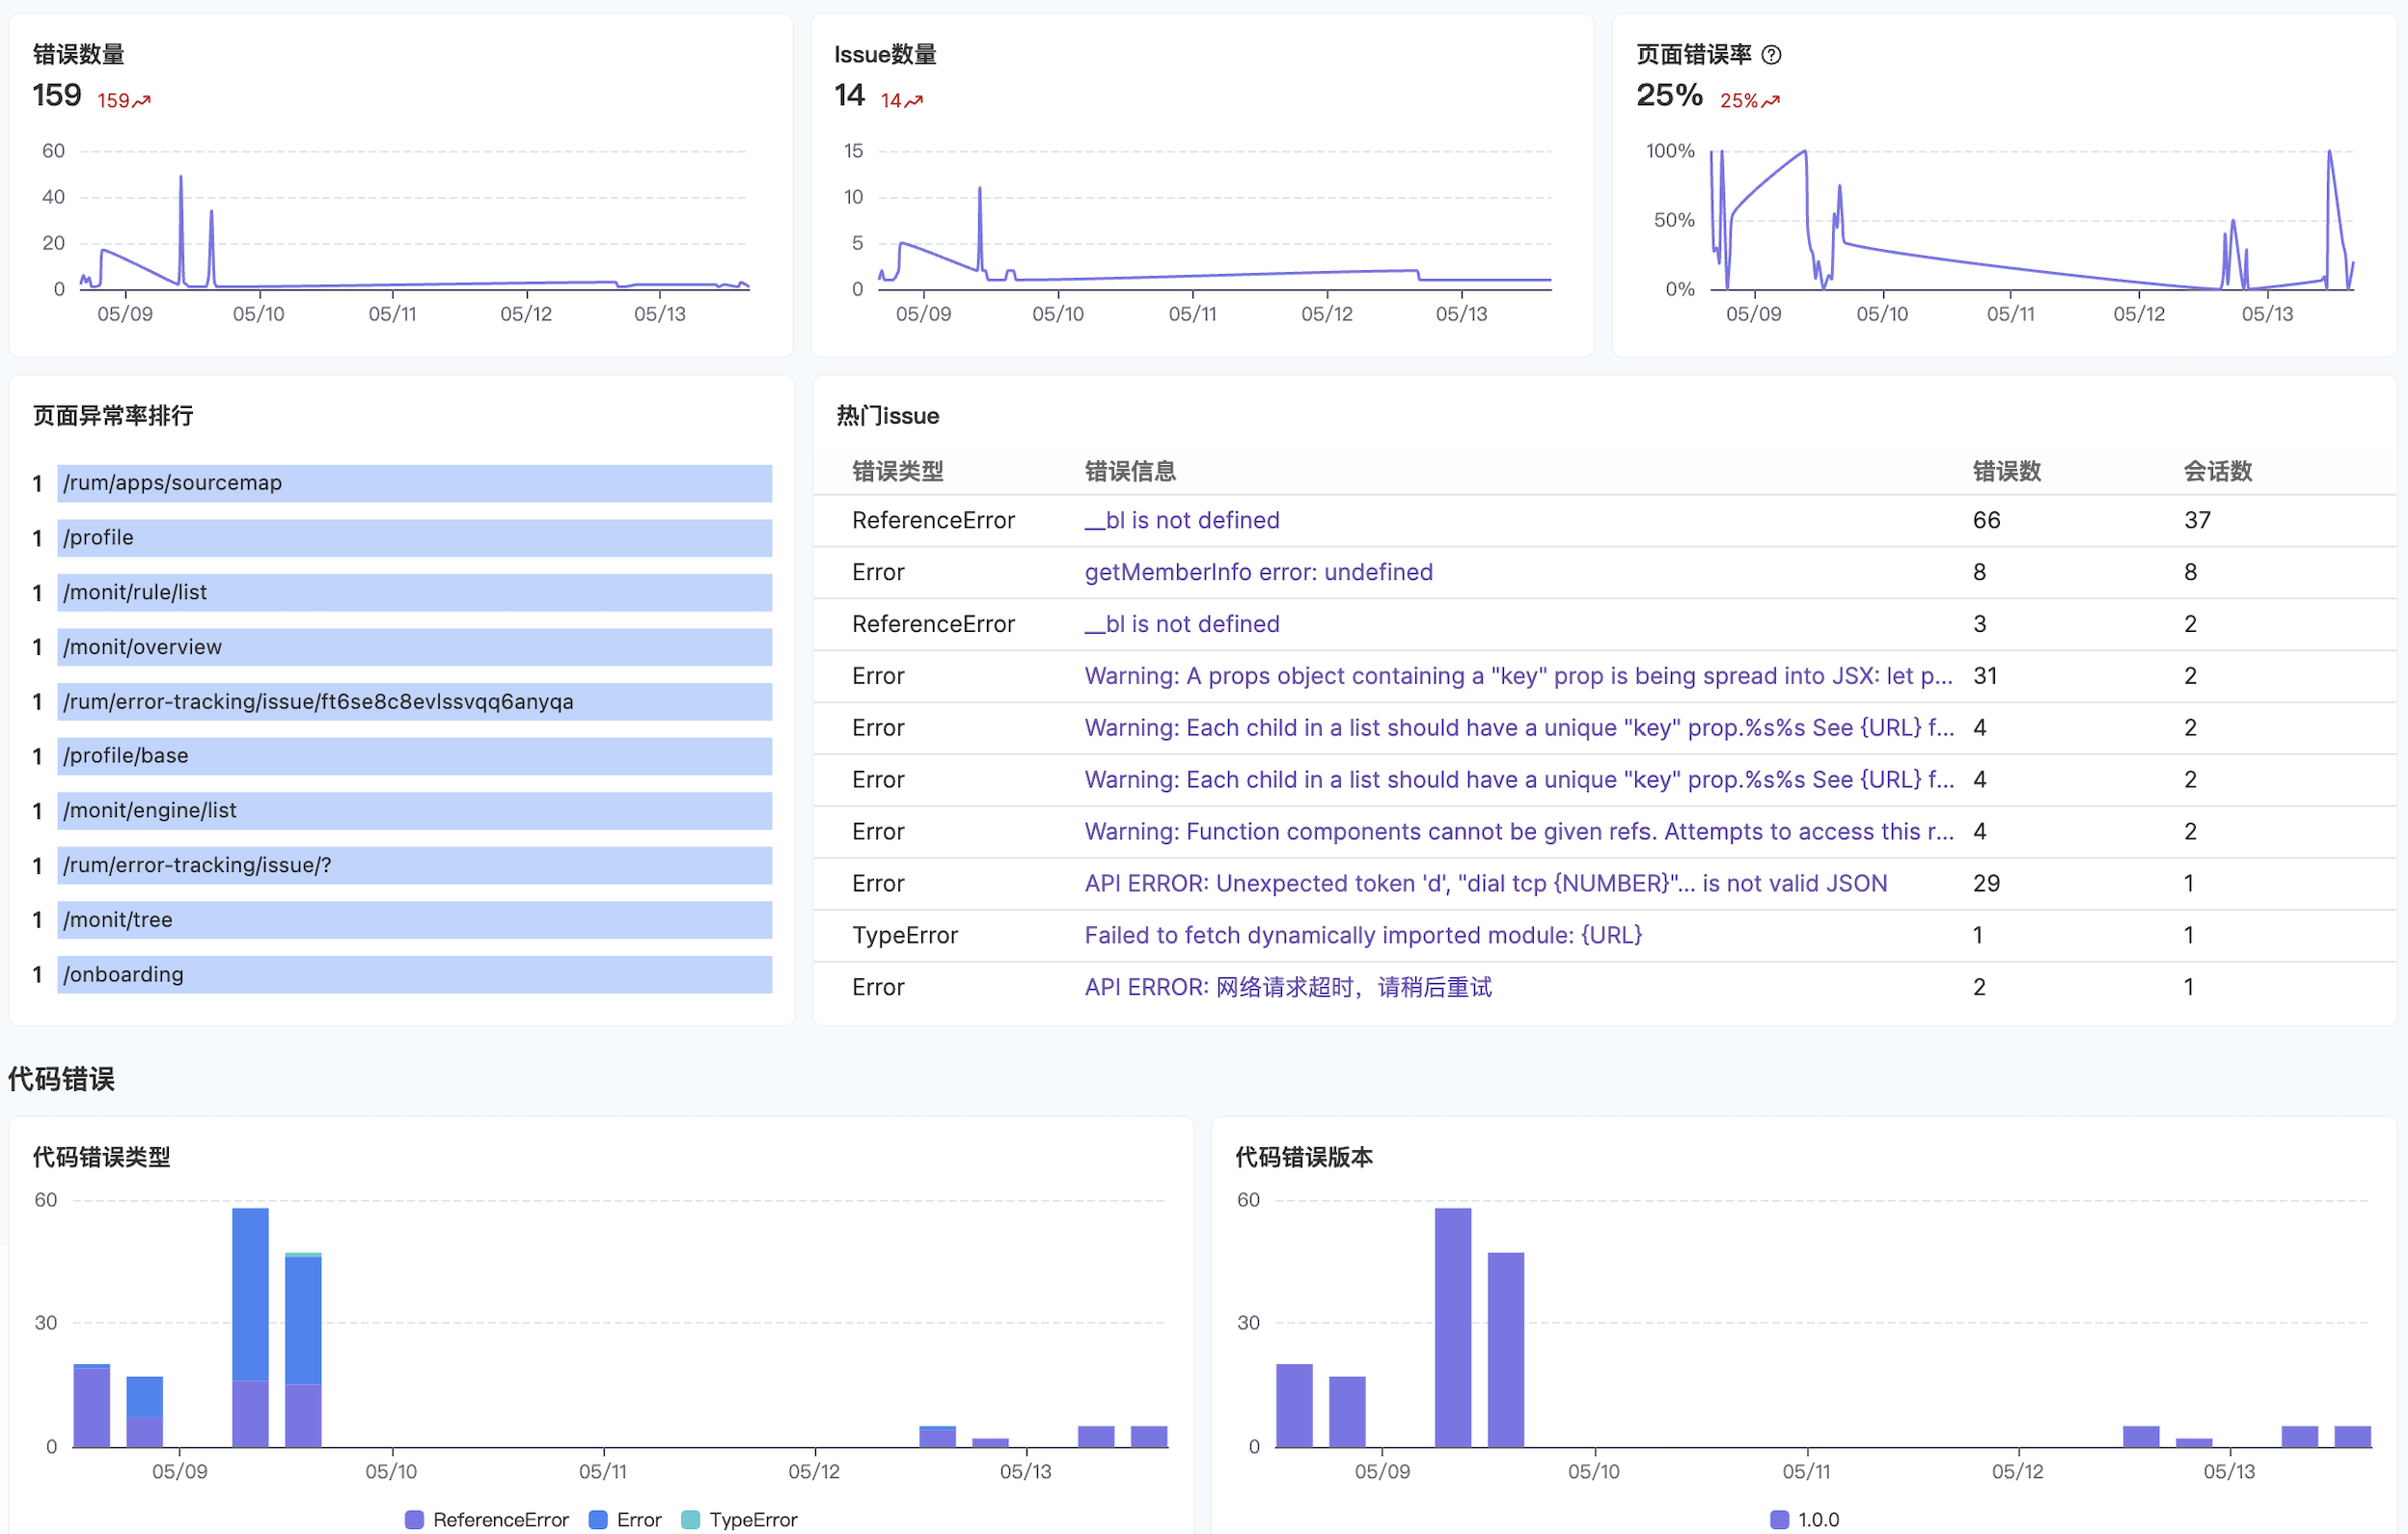
- Page Error Rate: Pages with the most errors, helping you prioritize which pages need attention
- Top Issues: Issues affecting the most users, see Error Grouping for details
- Code Errors: Categorized display of error types, see Error Tracking for details
- API and Resource Errors: Monitor which APIs and static resources generate the most errors
Resource Analysis
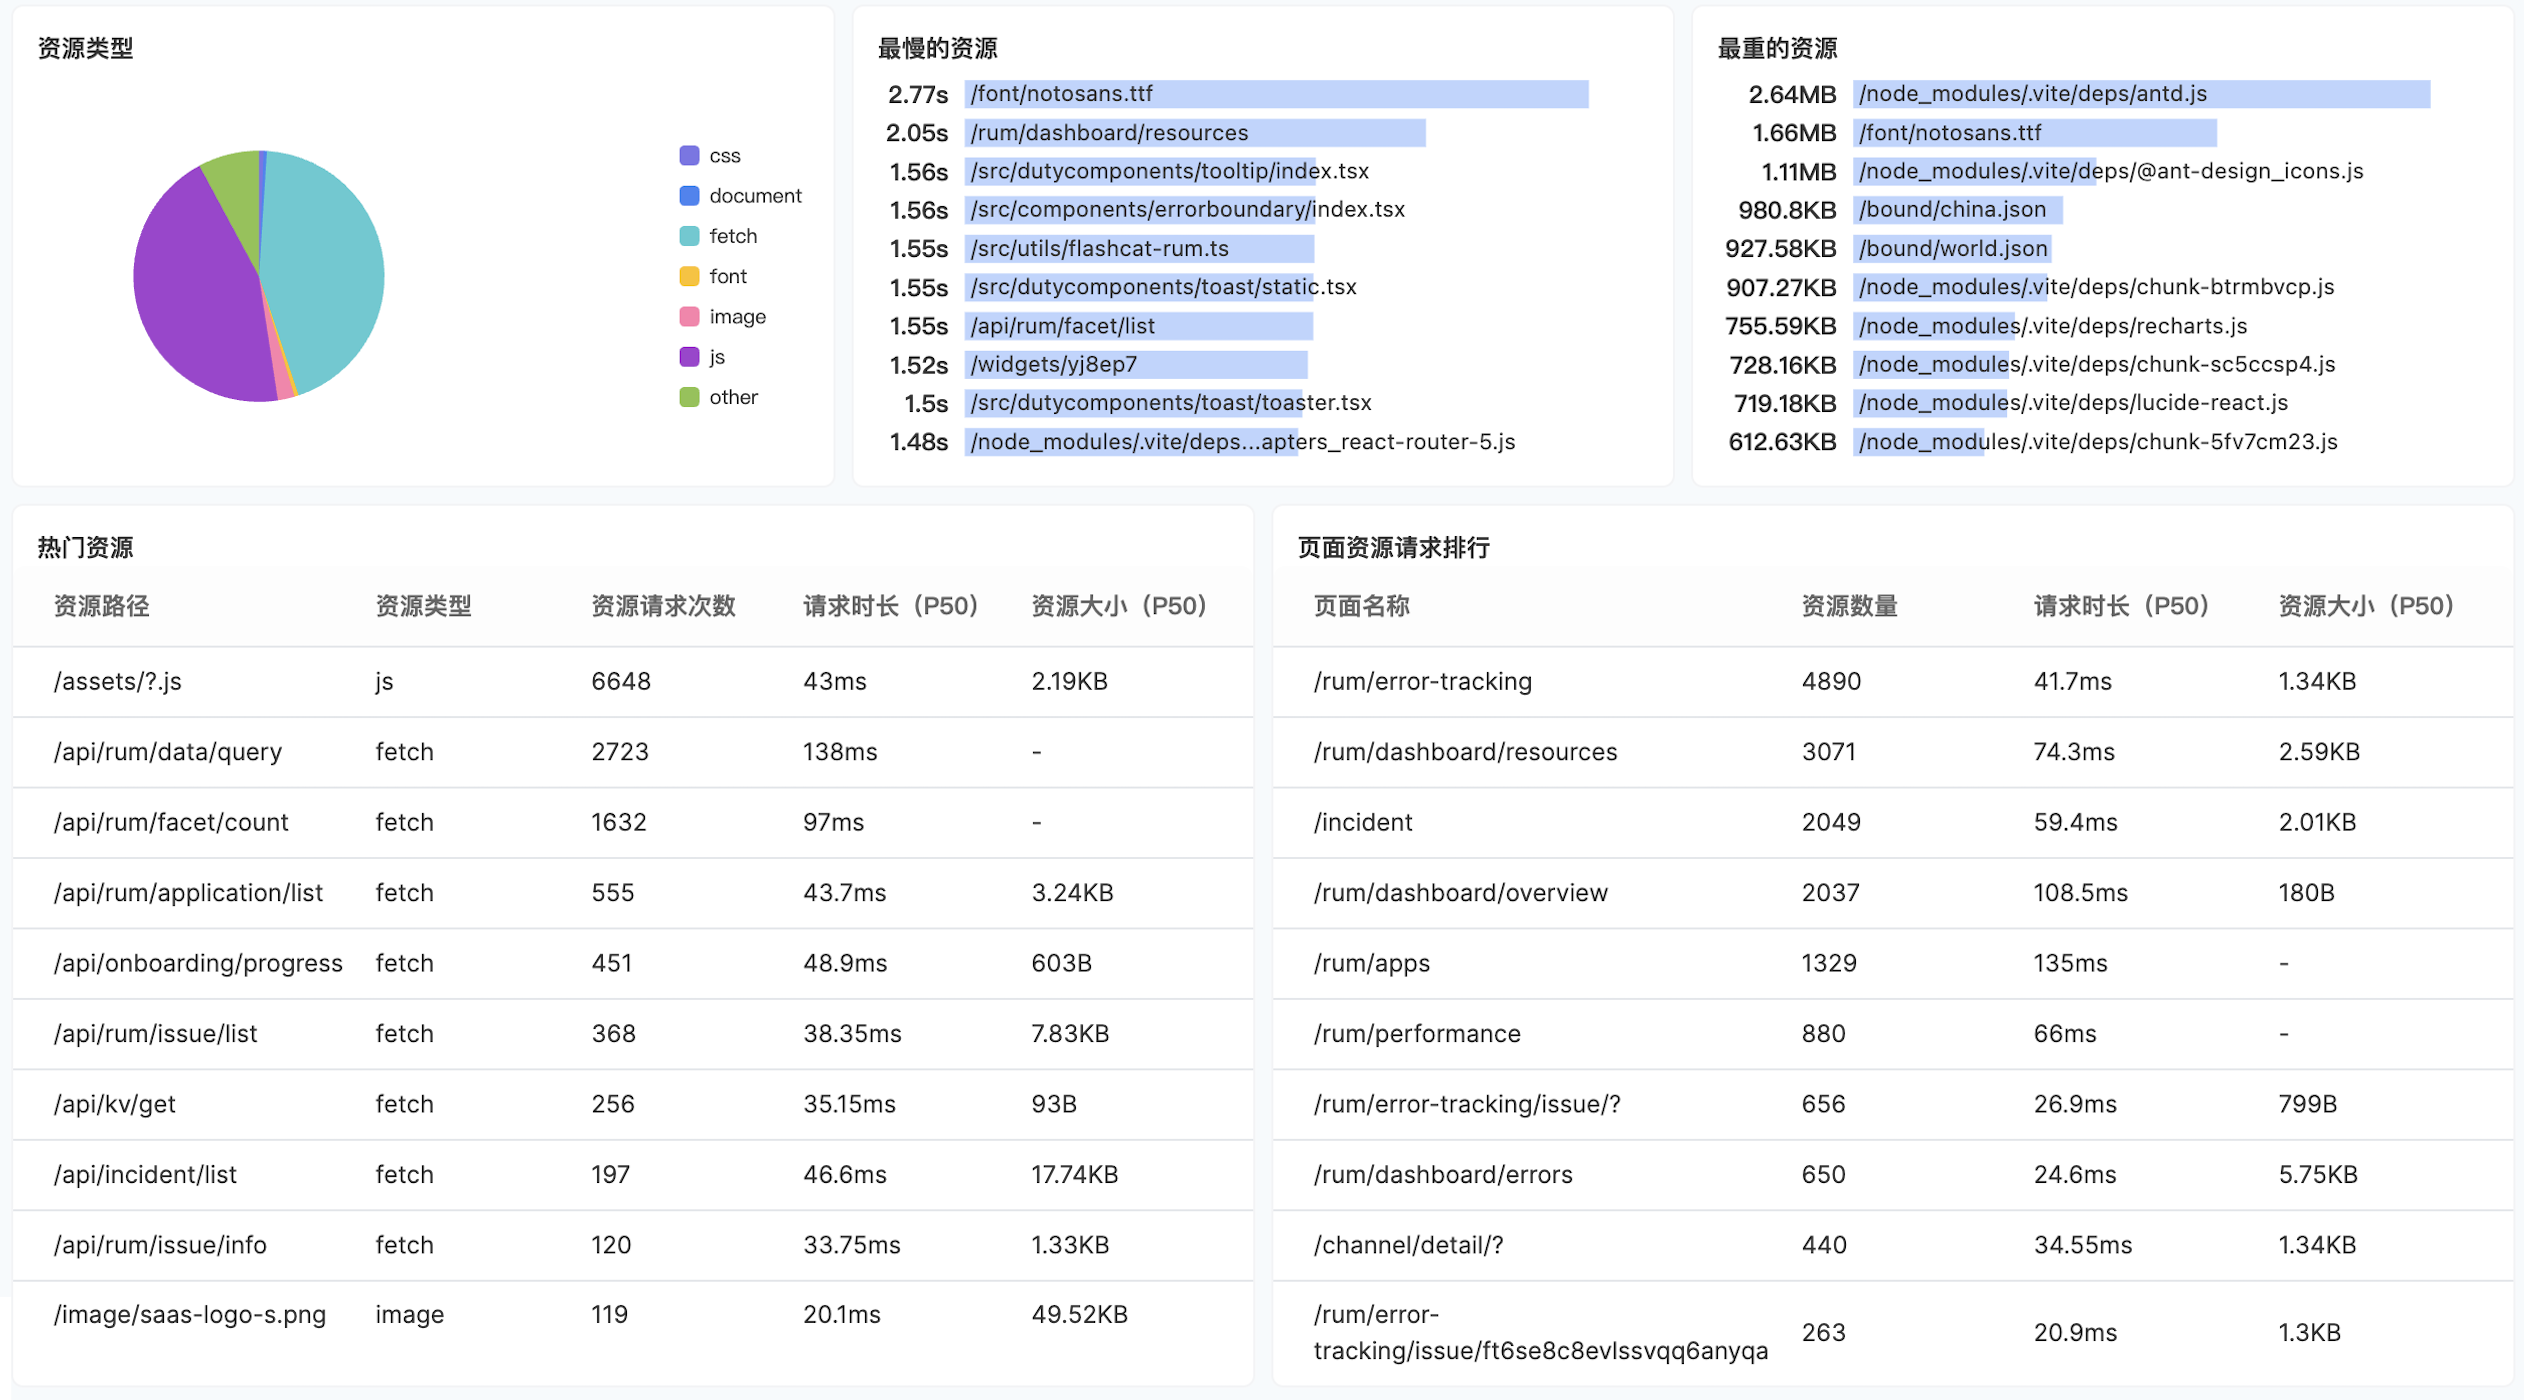
- Resource Ranking: Monitor the most frequently loaded and heaviest resources to identify optimization priorities
- Resource Loading Timeline: Monitor resource timing trends (DNS resolution, TCP connection, loading time, etc.)
- XHR and Fetch Requests: Distinguish distribution trends of different request types, methods, and error status codes
- Third-party Resources: Resources where the host address doesn’t match the current page host are identified as third-party resources
Traffic Distribution
The Traffic Distribution module helps you analyze the request distribution between self-hosted and third-party resources, identifying the impact of external dependencies on application performance. This module contains three parts:| Part | Description |
|---|---|
| Resource List | Aggregates resources by domain (Host), showing request count, P90/P50 duration, success rate, and resource provider category (self-hosted or third-party). Supports domain regex filtering and provider category filtering |
| Duration Trend | Displays a line chart comparing P90 duration trends between self-hosted and third-party resources, helping you determine whether third-party resources are slowing down overall loading speed |
| Traffic Share | Displays a pie chart showing the request volume share of each third-party domain, providing a clear view of traffic distribution across third-party services |
FAQ
Why is the size or timing data for some resources 0?
Why is the size or timing data for some resources 0?
This may occur due to:
- Connection Reuse (Keep-Alive): When resource requests use keep-alive to maintain connections, DNS lookups and TCP connection processes only occur on the first request, with subsequent requests reusing the same connection
- Cross-origin Resources: If resources are loaded cross-origin without the appropriate headers configured, the browser cannot collect complete performance data (primary cause)
- Browser Compatibility: In rare cases, some browsers may not support the Performance API
Why is resource_status 0 for some resources?
Why is resource_status 0 for some resources?
- Cross-origin Resources: If resources are loaded cross-origin without cross-origin access permissions set, the browser cannot obtain resource status information
- Browser Compatibility: Some browsers may not support the Performance API (rare)
How to resolve missing data for cross-origin resources?
How to resolve missing data for cross-origin resources?
1. Collect timing data for cross-origin resourcesAdd the following to the HTTP response headers of cross-origin resources:See MDN documentation Resource Timing API.2. Collect status codes for cross-origin resourcesAdd the following to the HTTP response headers of cross-origin resources:Add See MDN documentation Access-Control-Allow-Origin and crossorigin attribute.
crossorigin="anonymous" to the HTML tags that reference the resource:How to collect user information?
How to collect user information?
Logged-in User IdentificationFor applications that require user login (such as SaaS products, membership systems, e-commerce platforms, etc.), see User Sessions.Device Fingerprint IdentificationFor applications without login state (such as corporate websites, marketing pages, etc.), we recommend generating stable fingerprints based on multi-dimensional data like browser characteristics and device information, then reporting them as user identifiers.