Diagnosis and Optimization Workflow
You can navigate to the optimization page, located under the Performance Monitoring menu, and select the metric you want to analyze. You can also jump to this feature by viewing corresponding performance data in the analytics dashboard.Metric Selection
After selecting a page and metric, you can start performance data analysis:
- Click on a metric card to select the metric to analyze (currently supports LCP, FCP, INP, CLS)
- Select a group in “Show Filter Breakdown”
- Evaluate metrics at different percentiles (e.g., p75 represents the 75th percentile value)
Data Viewing
You can view the data performance of the metric under different conditions by adjusting the data aggregation method or modifying filter conditions, thereby advancing diagnosis and optimization work.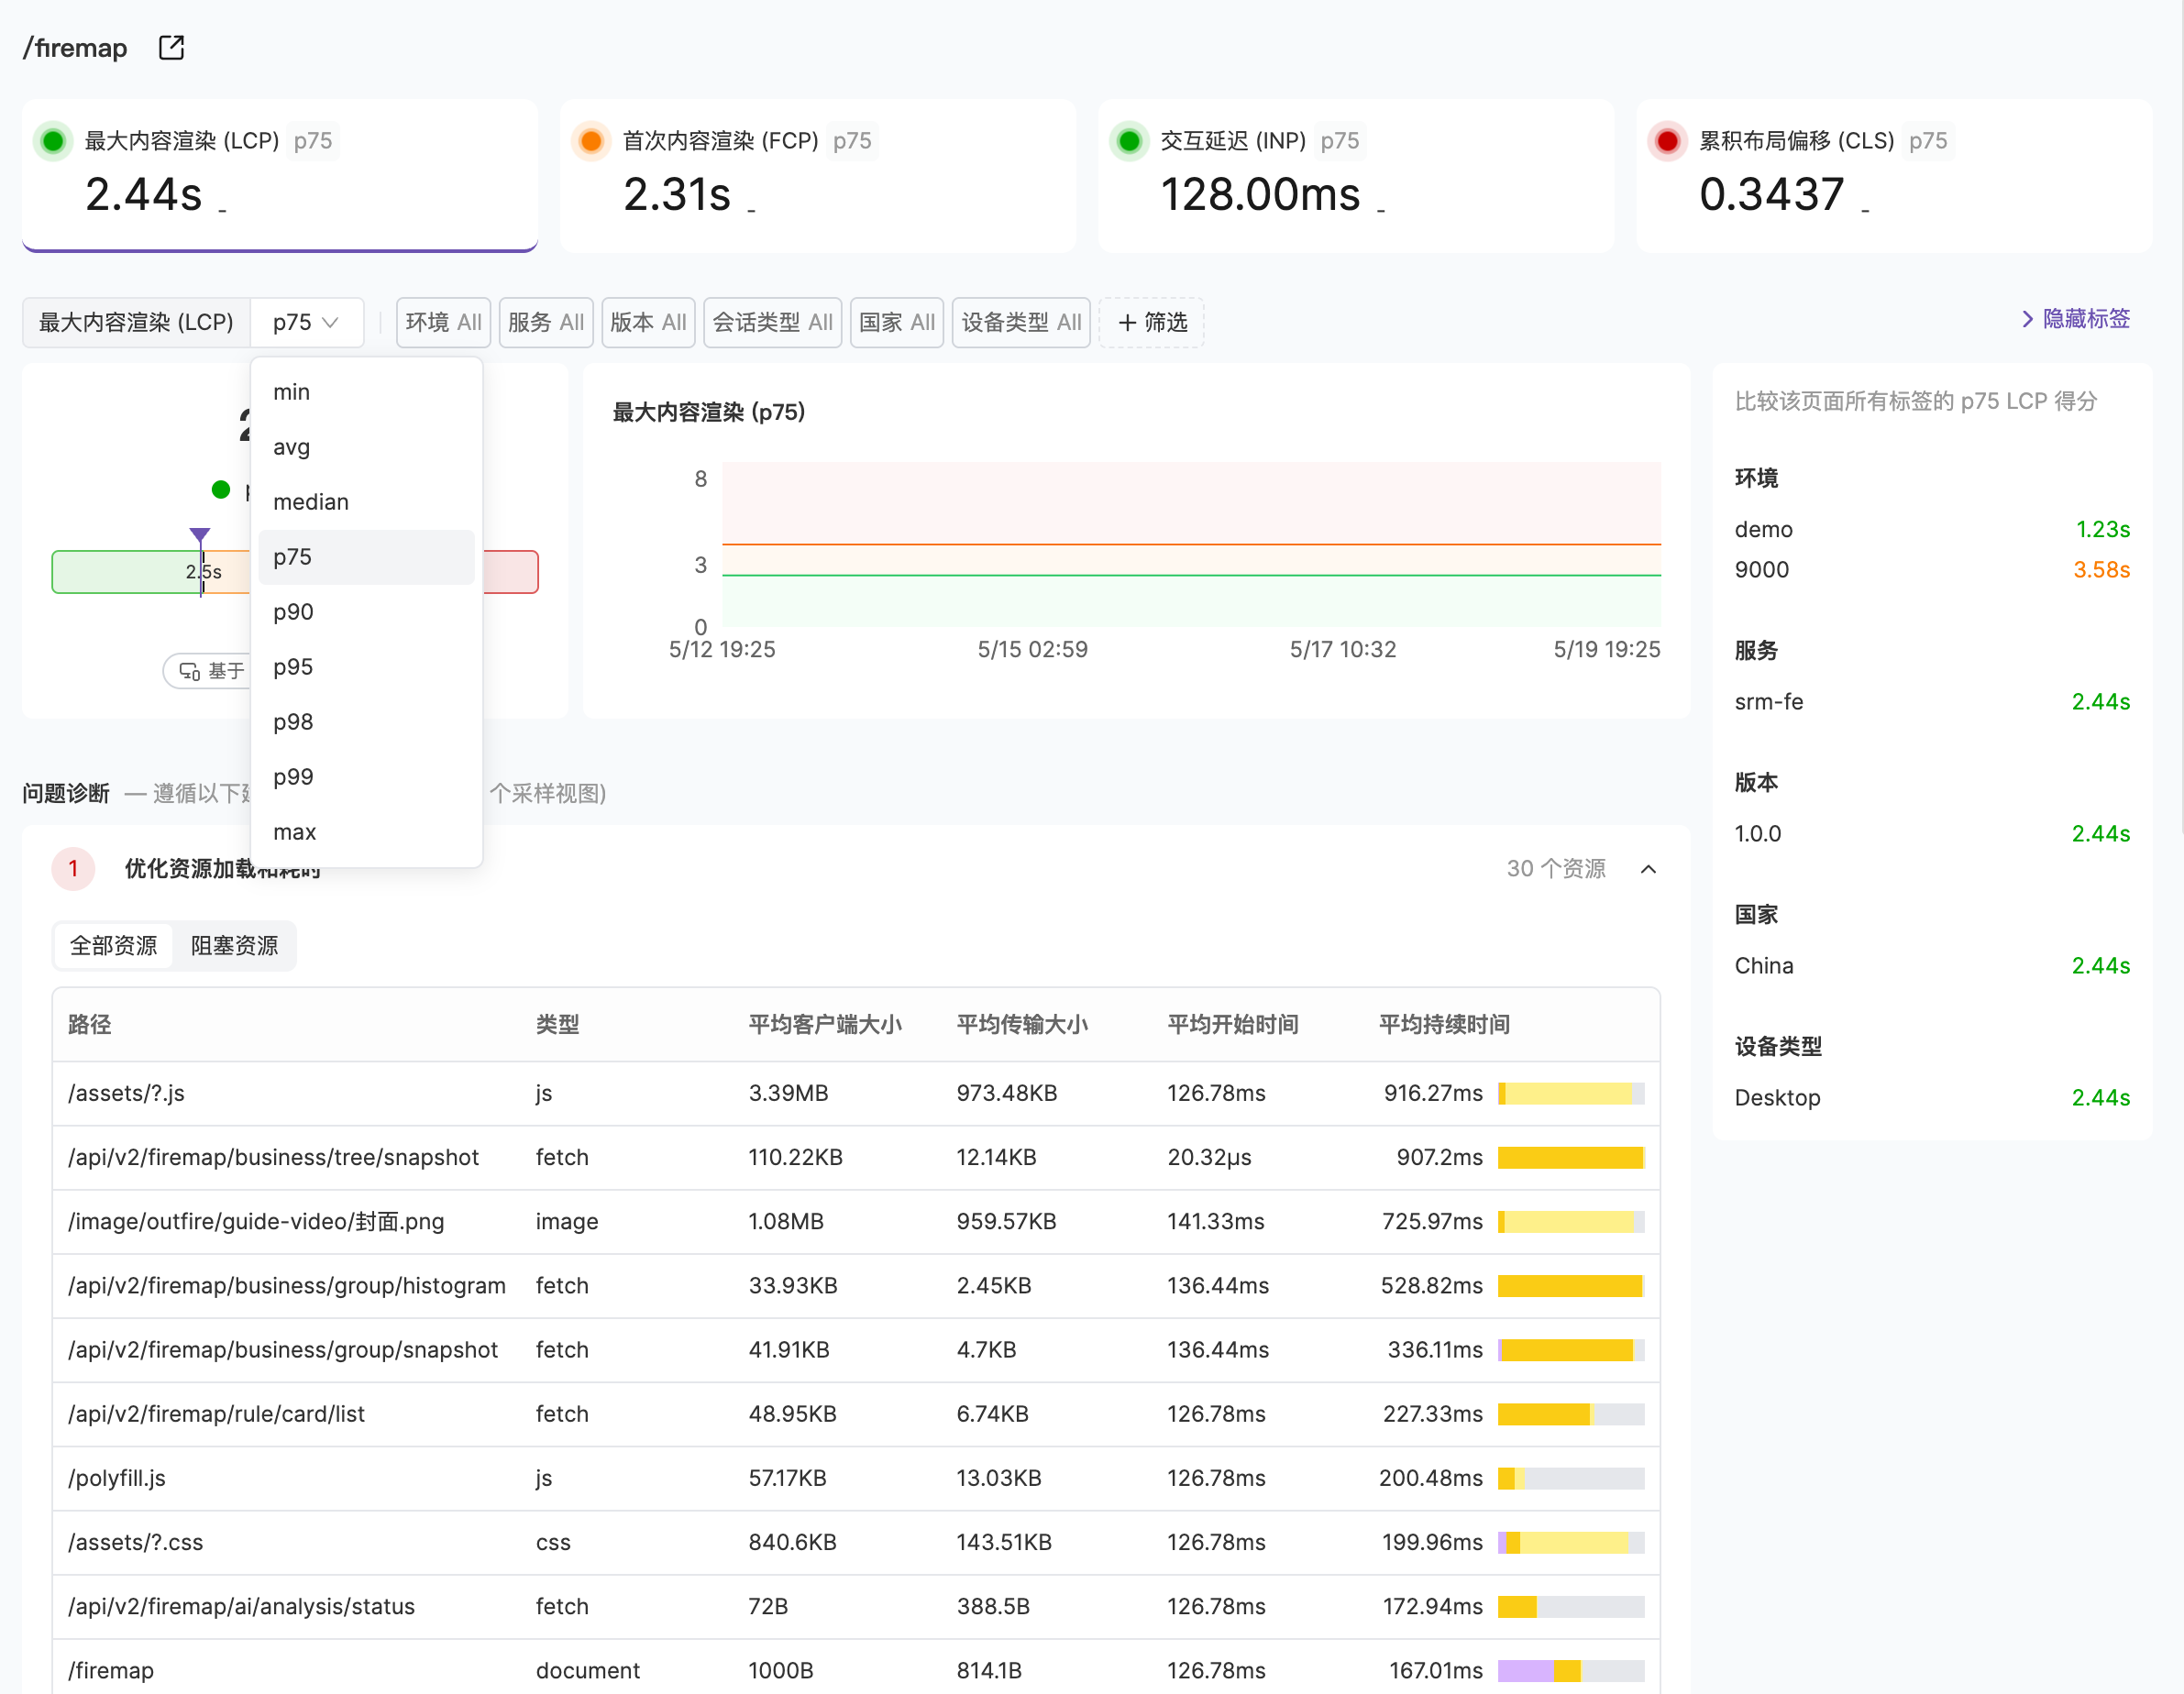
Problem Diagnosis
In the problem diagnosis section, you can see resources and errors that users encountered on the page that may affect metric performance.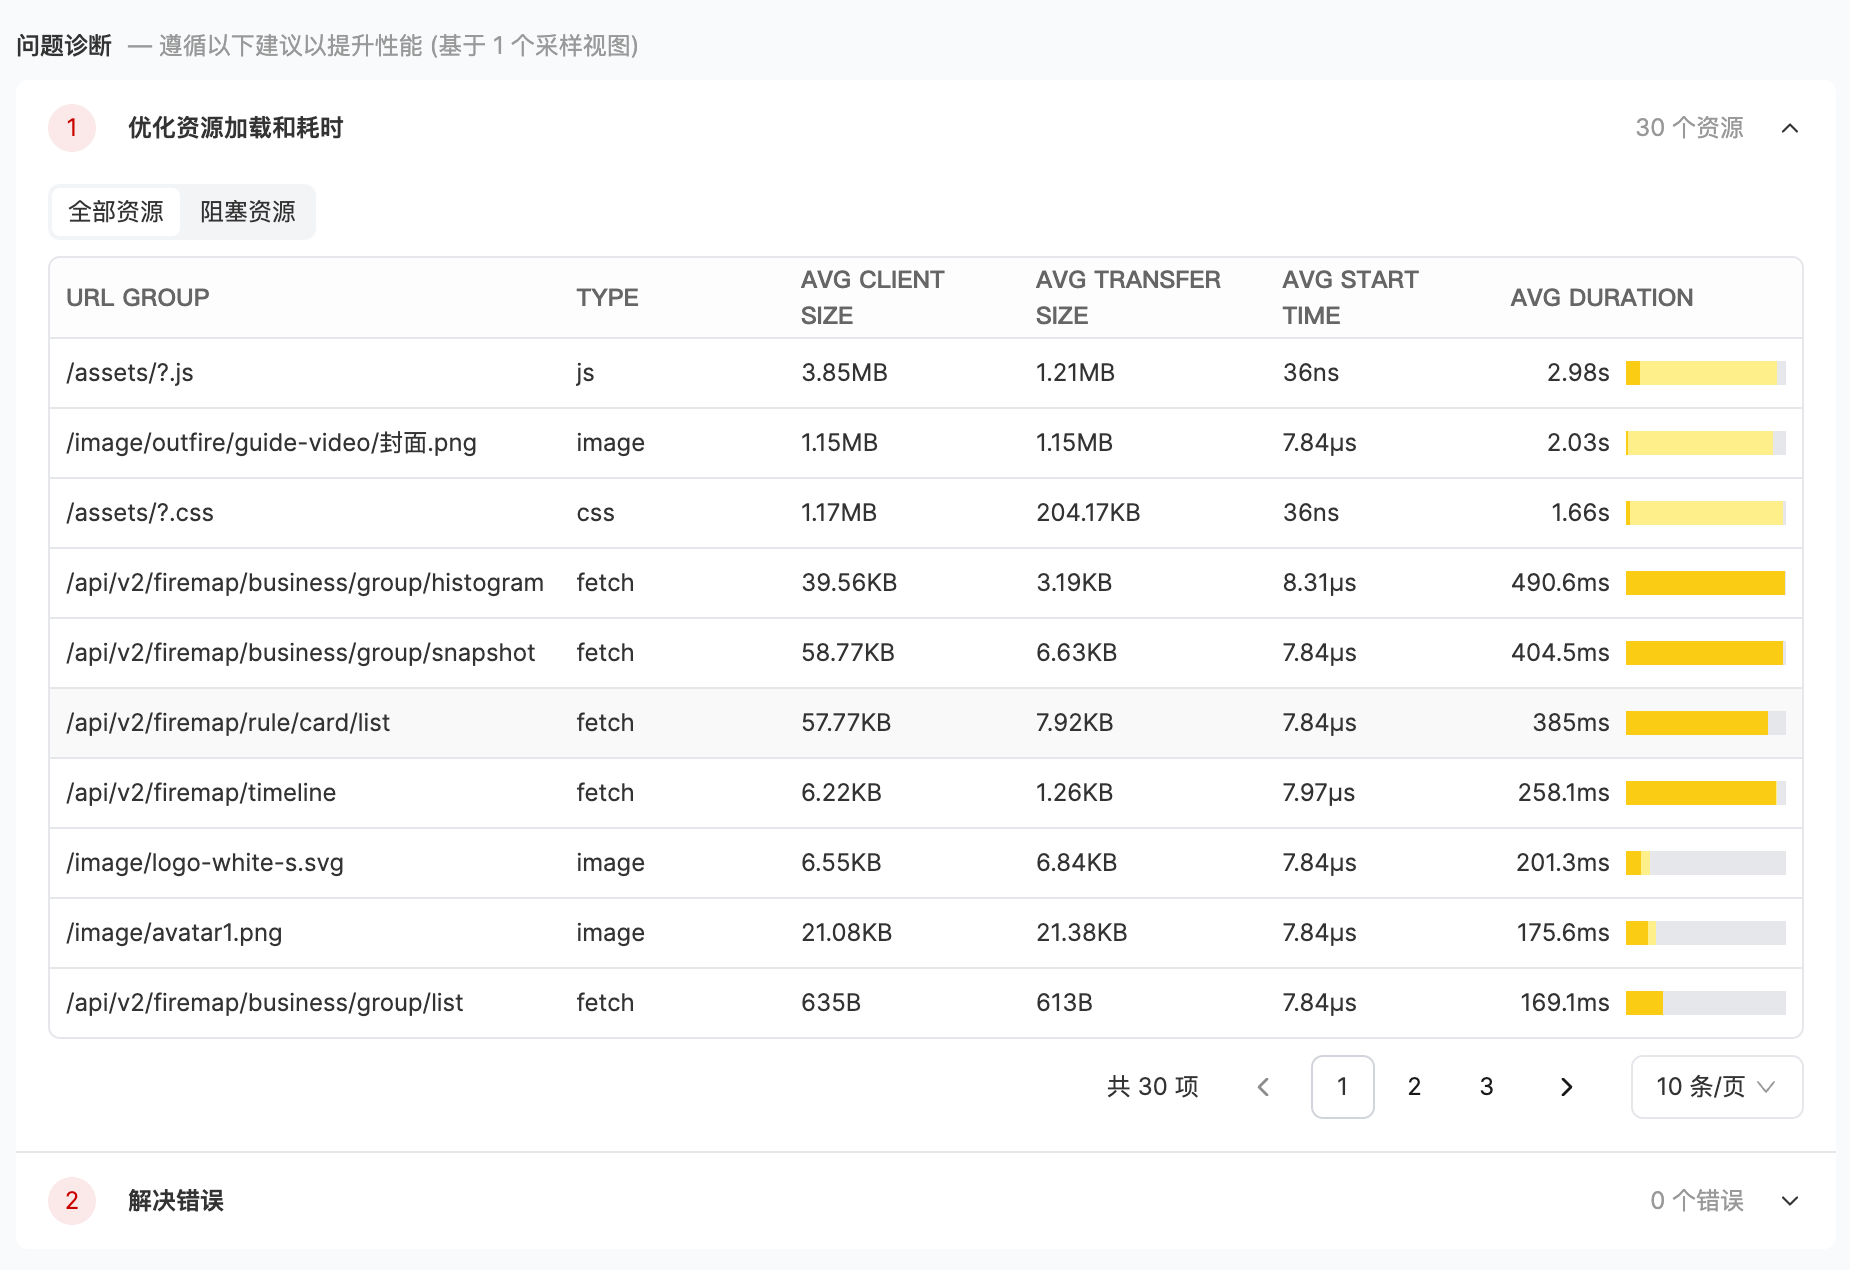
Optimization Directions
- Optimize Resource Loading
- Resolve Errors
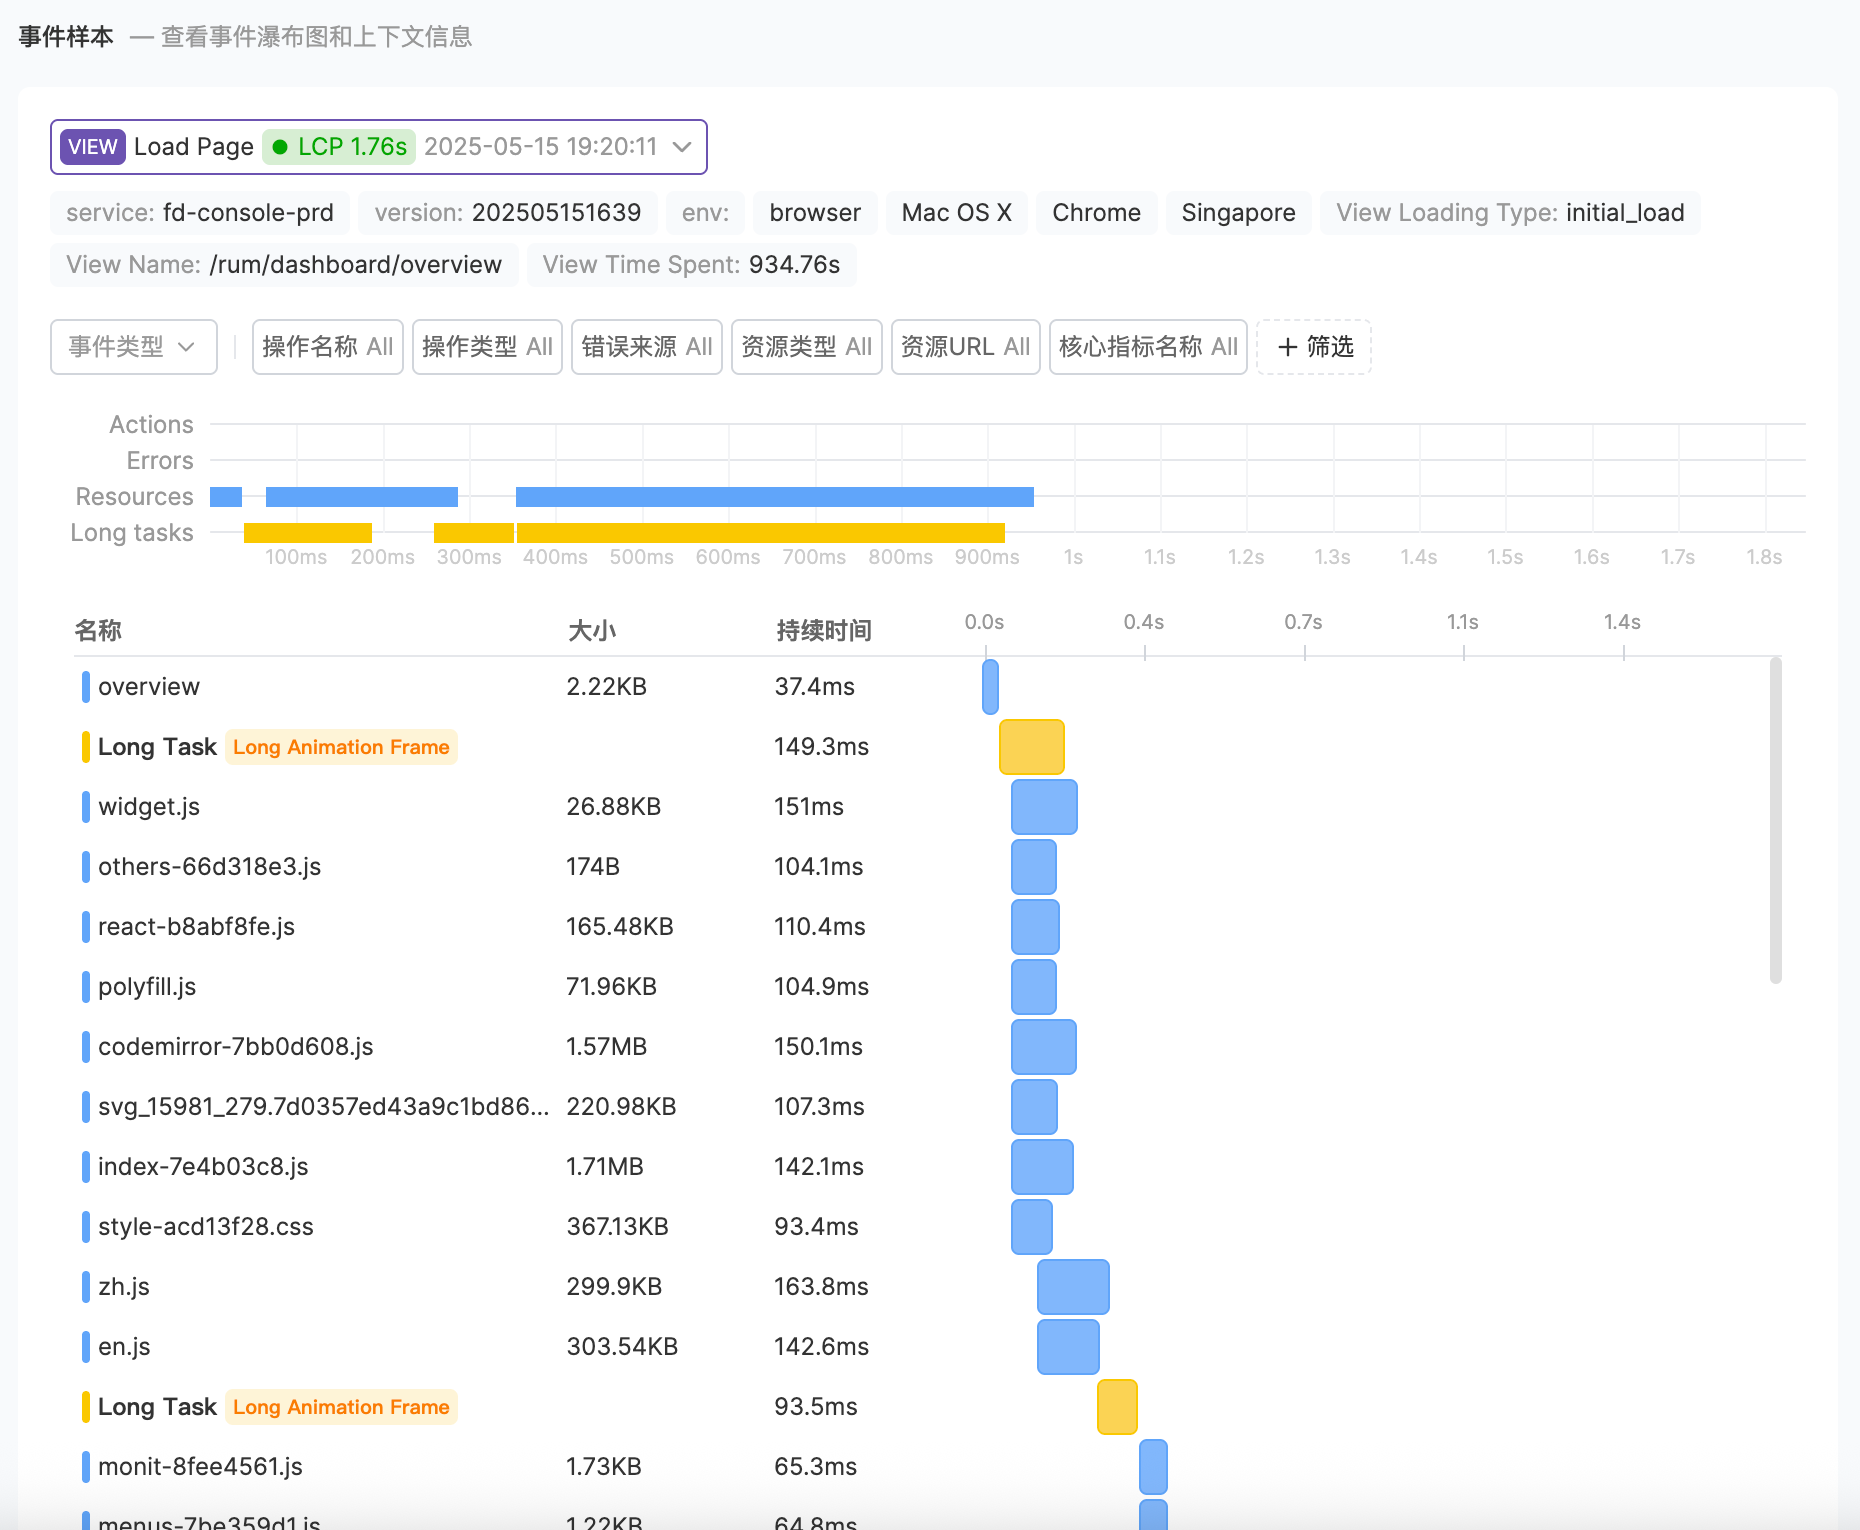
- Waterfall Chart Analysis
The resource loading analysis panel displays detailed loading information for all resources under the current view, helping you identify performance bottlenecks.You can switch between two tabs to control the viewing scope:
- All Resources: Shows all resources loaded in the view
- Blocking Resources: Shows only resources marked as
blockingrender-blocking resources, which delay the page’s first render
| Field | Description |
|---|---|
| URL GROUP | URL path group of the resource |
| TYPE | Resource type (such as JS, CSS, Image, etc.) |
| AVG CLIENT SIZE | Average client-side resource size |
| AVG TRANSFER SIZE | Average transfer size (if transfer size is significantly smaller than client size, it indicates some samples hit cache) |
| AVG START TIME | Average loading start time |
| AVG DURATION | Average loading duration, with a color bar visualizing the proportion of DNS resolution, connection establishment, first byte wait, and download phases |