Accessing Performance Analysis
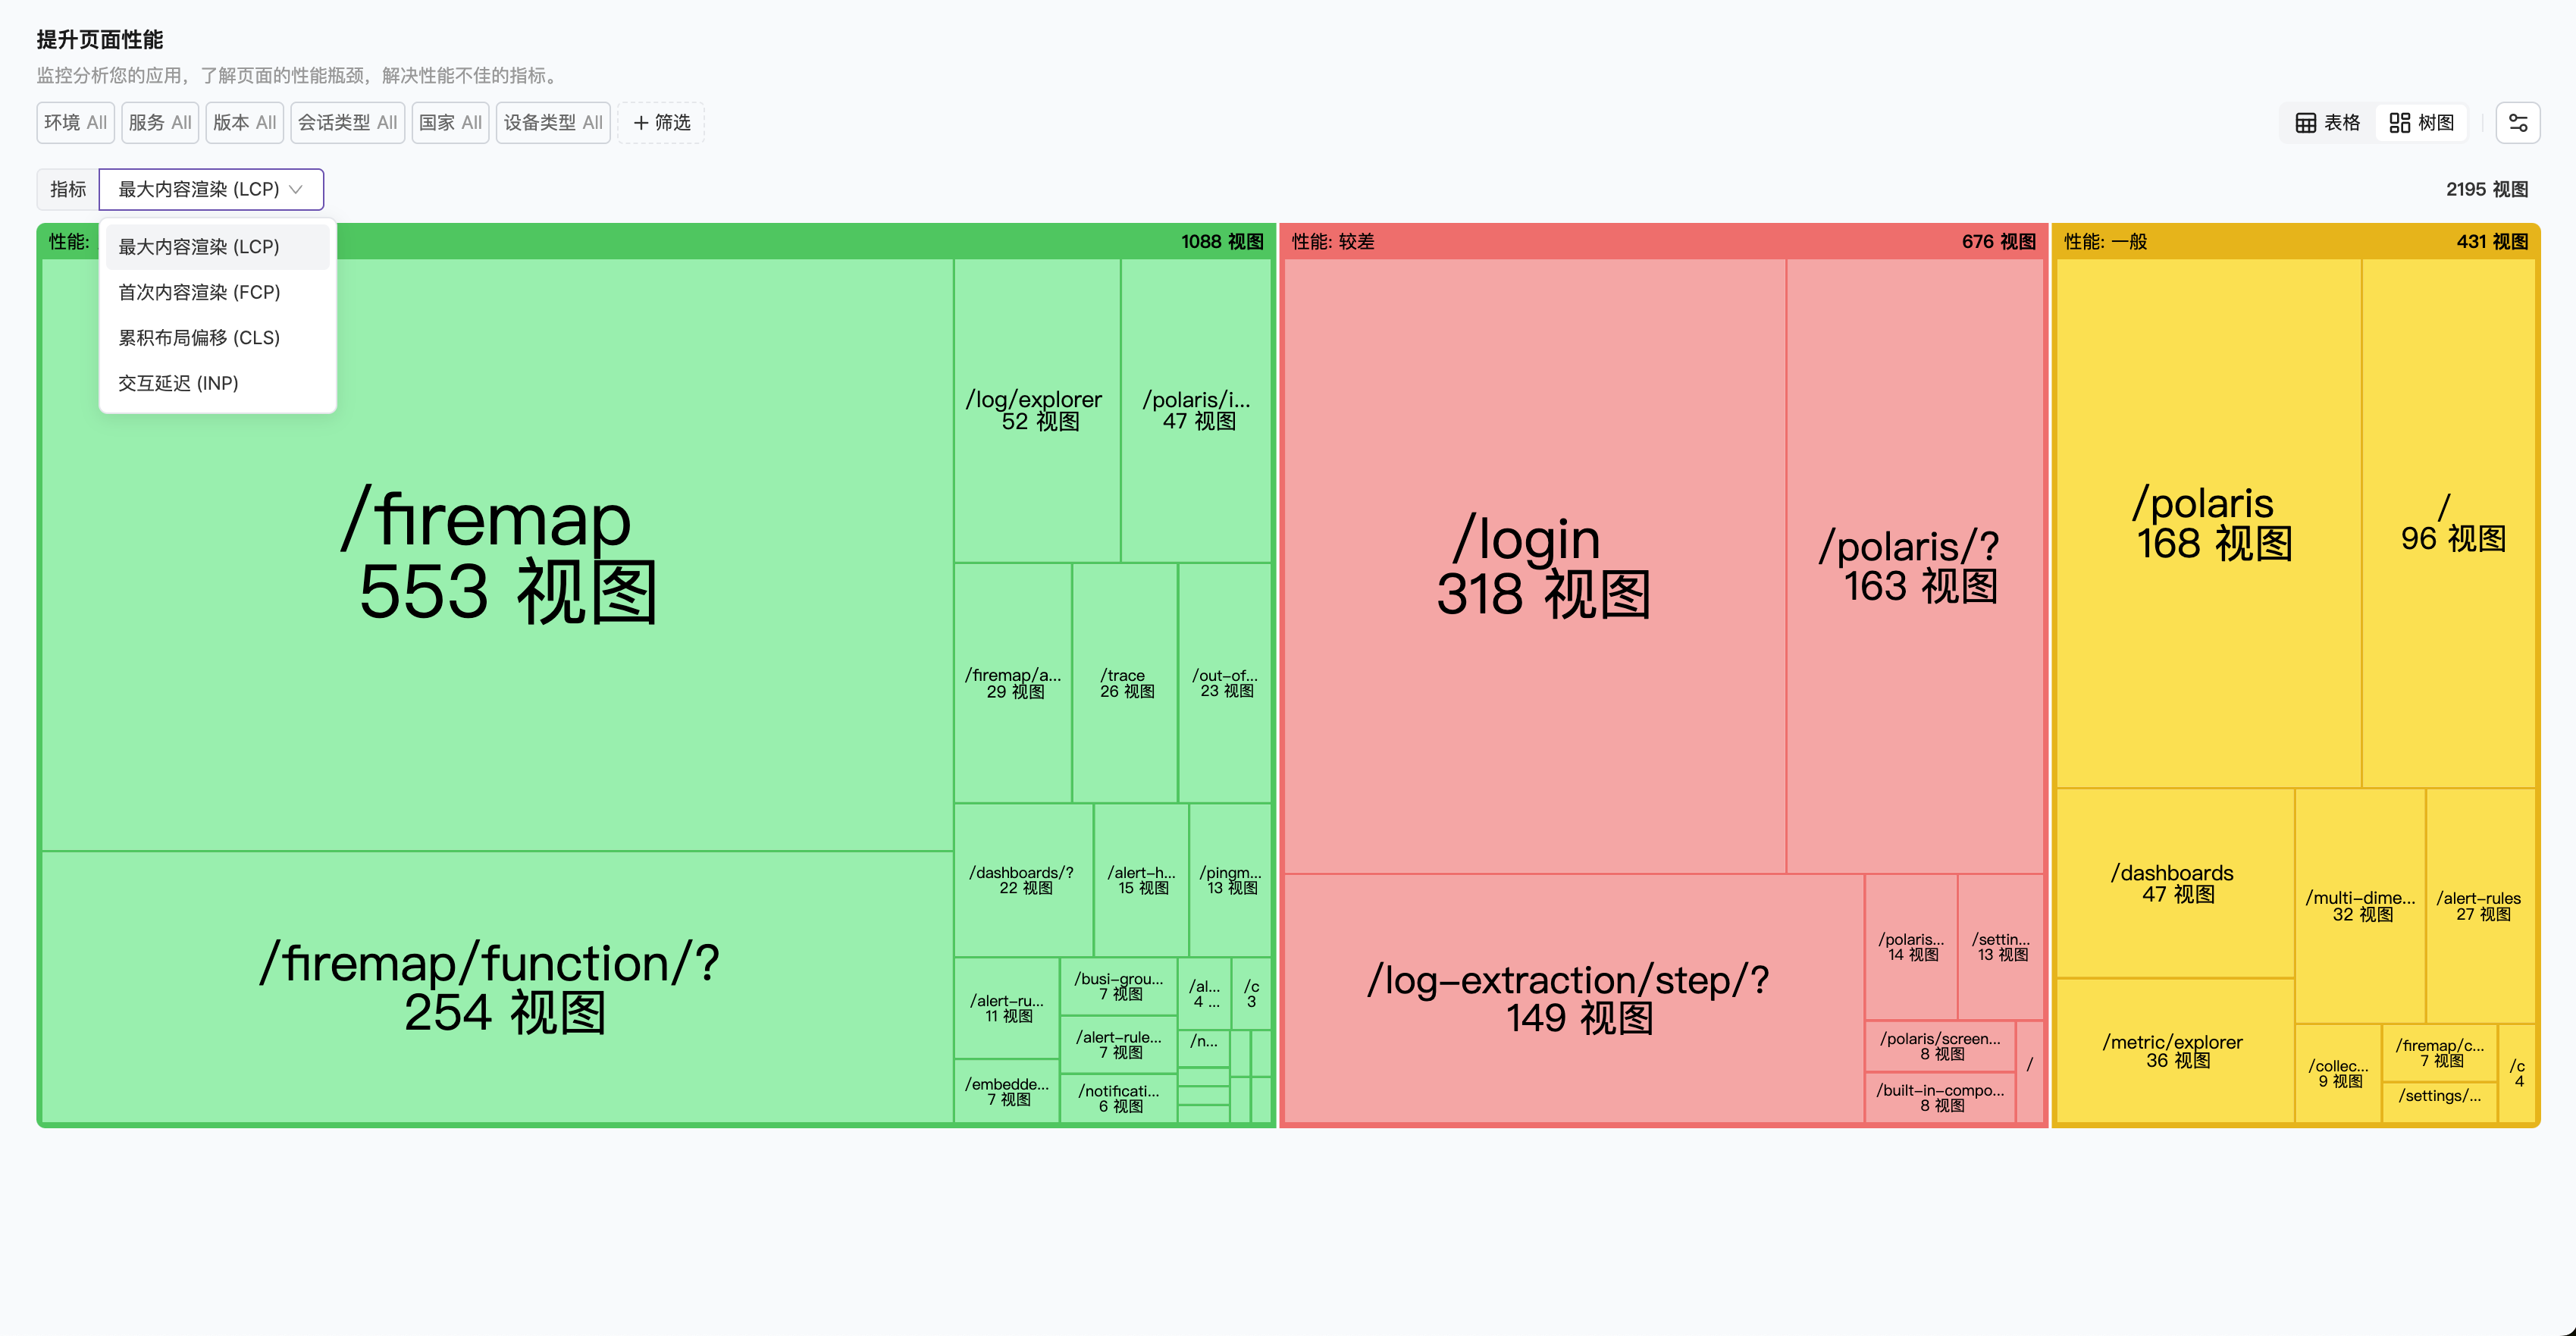
Navigate to the Performance Monitoring menu, where you can analyze performance experience from different perspectives through list or tree views.- Resource Perspective
- Metric Perspective
Switch to list view to see the data for each metric under Top pages sorted by page: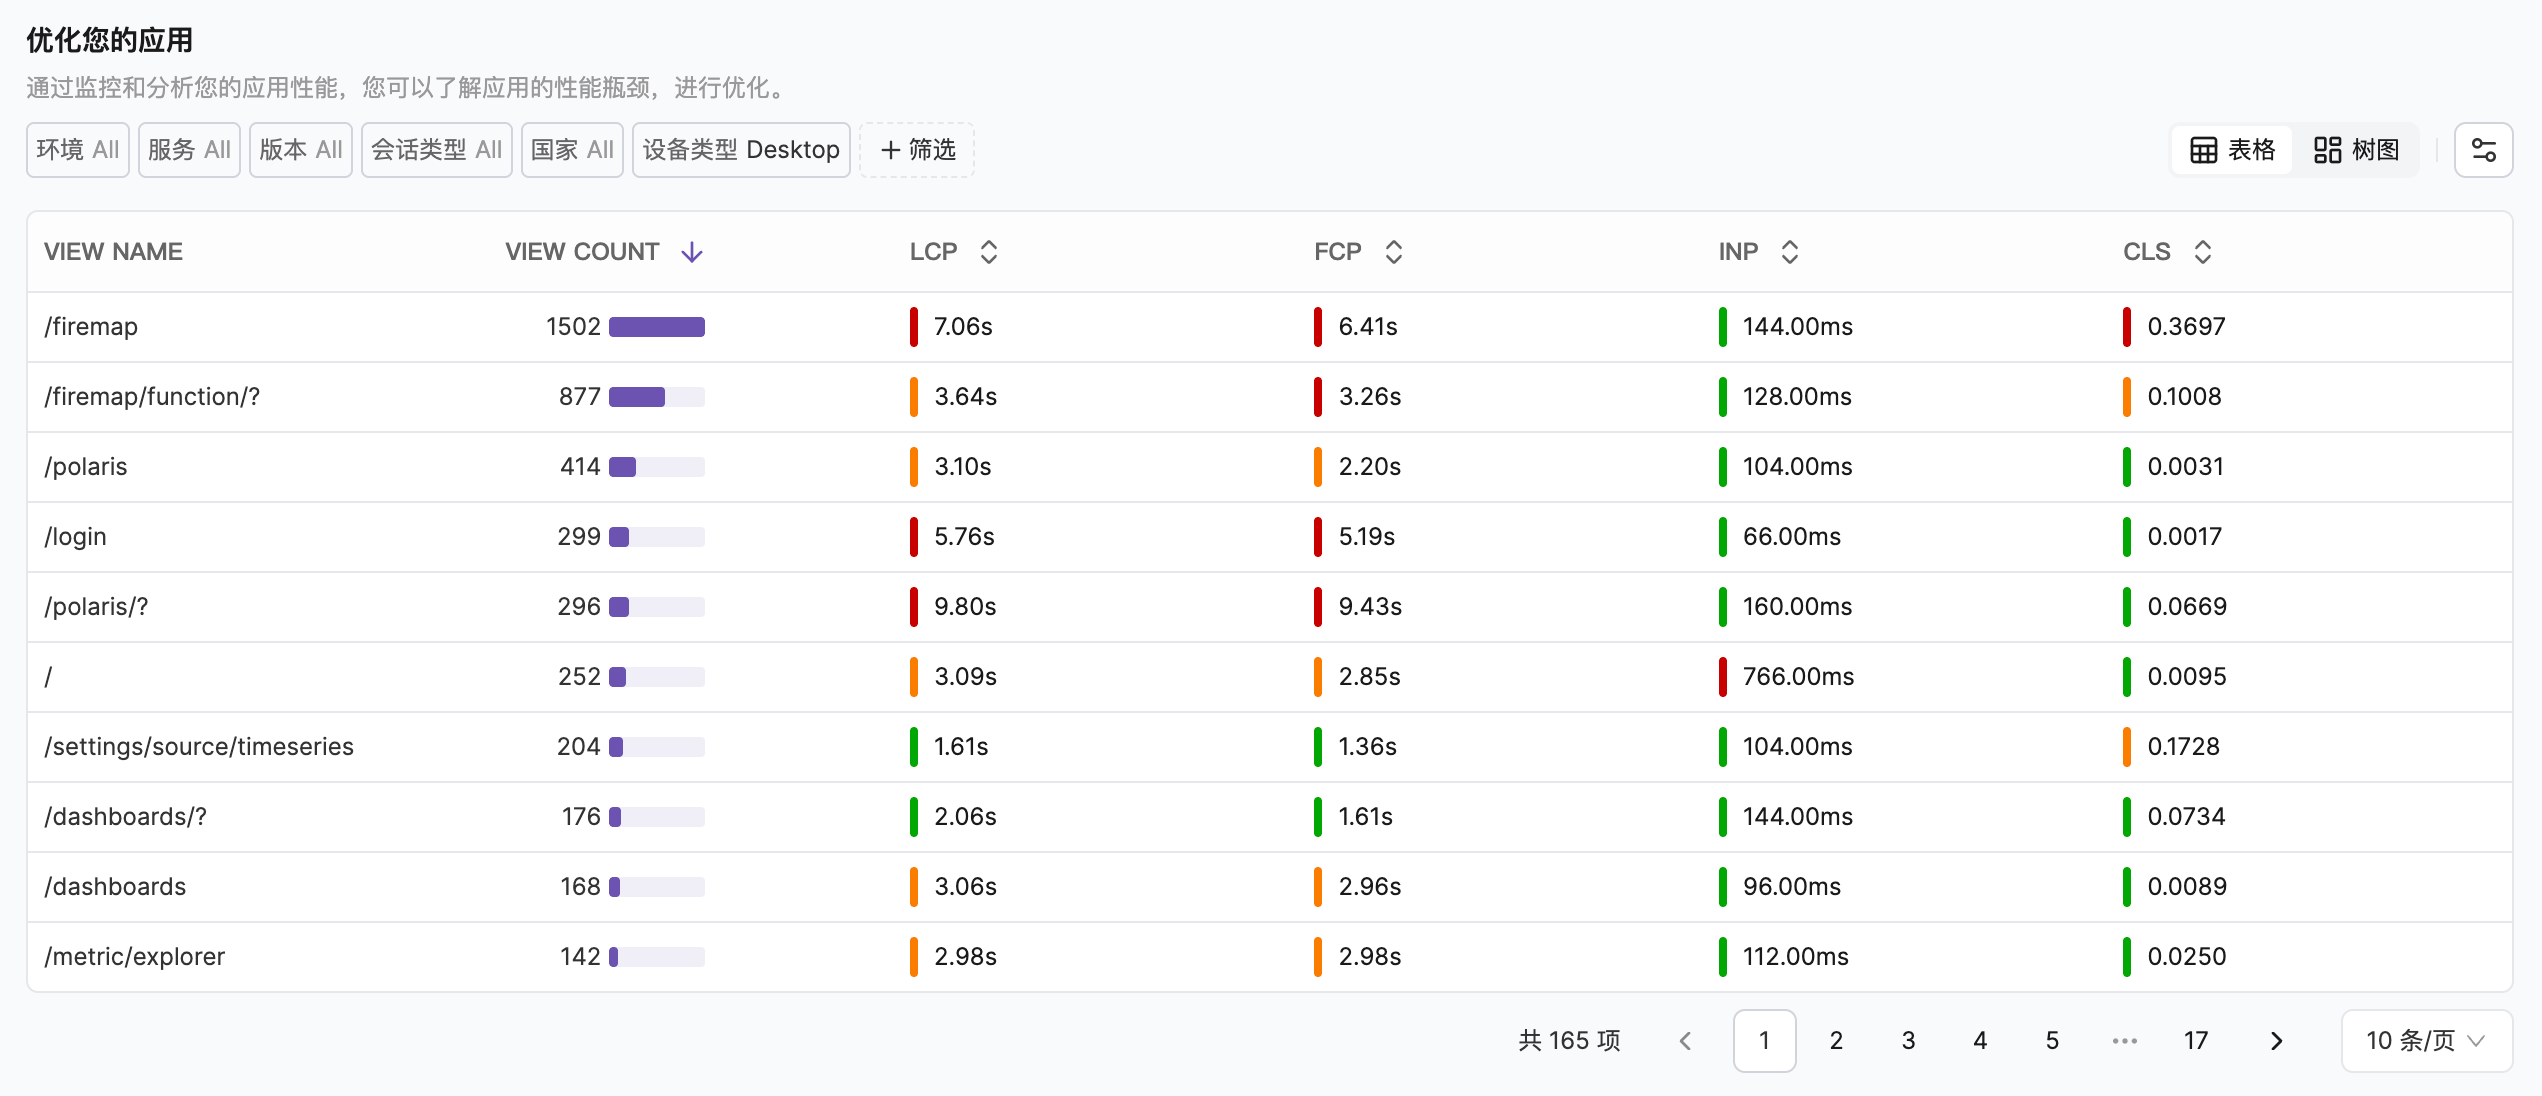
- Quickly view the overall metrics through the color indicators in front of the metric data to locate metrics that need improvement
- Hover over each metric to see its current level under the standard
- Click each row to view metric details for that page
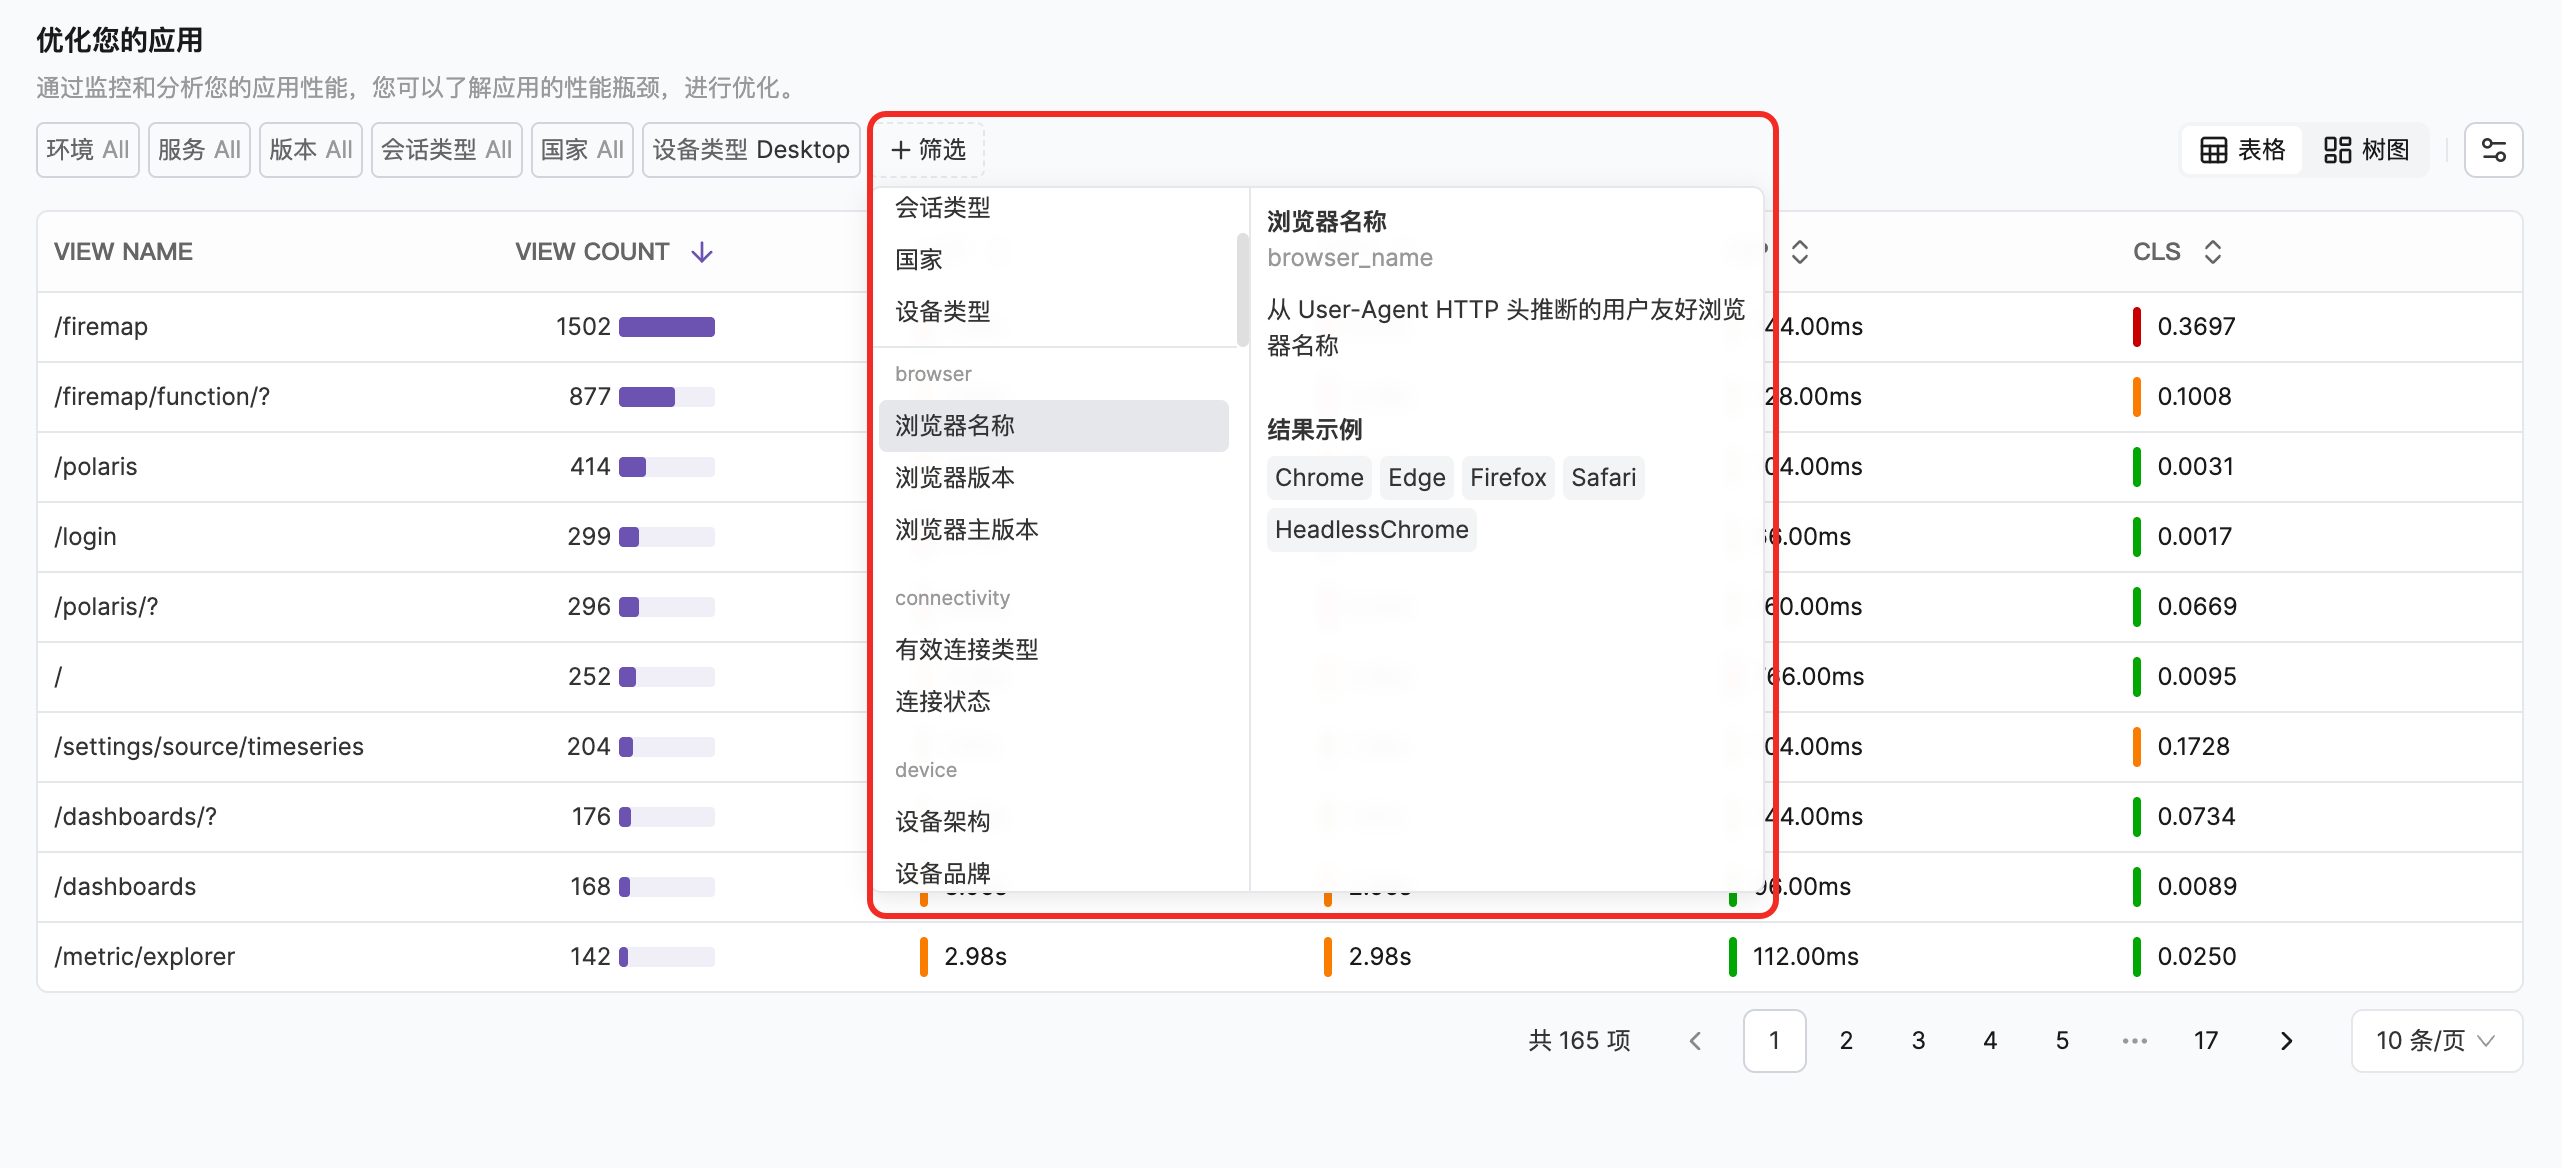
Data Analysis Dimensions
Through global filters, you can analyze page performance from different dimensions to gain insights into performance data trends:| Dimension | Description |
|---|---|
| Browser | Filter by browser type |
| Connection Status | Filter by network connection status |
| Device | Filter by device type |
| Geolocation | Filter by geographic location information |
Next Steps
Diagnosis and Optimization
Learn problem diagnosis and optimization methods