
VictoriaLogs
1. 前置说明
1.1 原理说明
/select/logsql/query 接口。该接口返回的数据可以看作是一个二维表格,在阈值判定模式下需要用“标签字段”和“值字段”进行映射。/select/logsql/stats_query 接口。该接口返回的数据遵从 Prometheus 协议格式,Monitors 自动识别哪些字段是标签,哪些字段是值,无需额外配置。1.2 查原文
error | fields _time, _stream, _msg | sort by (_time) desc1.3 做统计
stats 关键字。相关配置项说明:_time:1d | stats by (level) count(*) total_time 过滤条件,例如 _time:5m,以限定查询的时间范围。否则就是查全部数据,可能导致性能问题。2. 阈值判定模式 (Threshold)
2.1 查原文示例
level:ERROR | stats by (level) count(*) total| level | total |
|---|---|
| ERROR | 150 |
total,标签字段�配置为 level(或不配置,Monitors 会自动识别)。不同阈值不同级别的配置示例:$A.total >= 50 或者简写为 $A >= 50(因为只有 total 这一个值字段)$A.total >= 100 或者简写为 $A >= 100(因为只有 total 这一个值字段)2.2 做统计示例
_time:1d and level:ERROR | stats by (level) count(*) totaltotal{level="ERROR"} 150$A.total >= 50 或者简写为 $A >= 50(因为只有 total 这一个指标字段)$A.total >= 100 或者简写为 $A >= 100(因为只有 total 这一个指标字段)2.3 恢复逻辑
$A.total < 10,只有在错误数跌落到 10 以下时才认为恢复,减少抖动。${label_name}),这些变量会被自动替换为告警事件中对应的标签值,使得恢复查询能够针对具体的告警对象进行检测。3. 数据存在模式 (Data Exists)
_time:15m and level:ERROR | stats by (level) count(*) total | filter total:>10| filter total:>10 用于筛选出 total 大于 10 的数据,只要有满足该条件的数据行返回,Monitors 就会触发告警。如果某个阶段没有任何数据行满足该条件,则认为该告警恢复。4. 数据缺失模式 (No Data)
4.1 配置示例
_time:15m and level:INFO | stats by (level) count(*) total5. 获取告警时日志原文
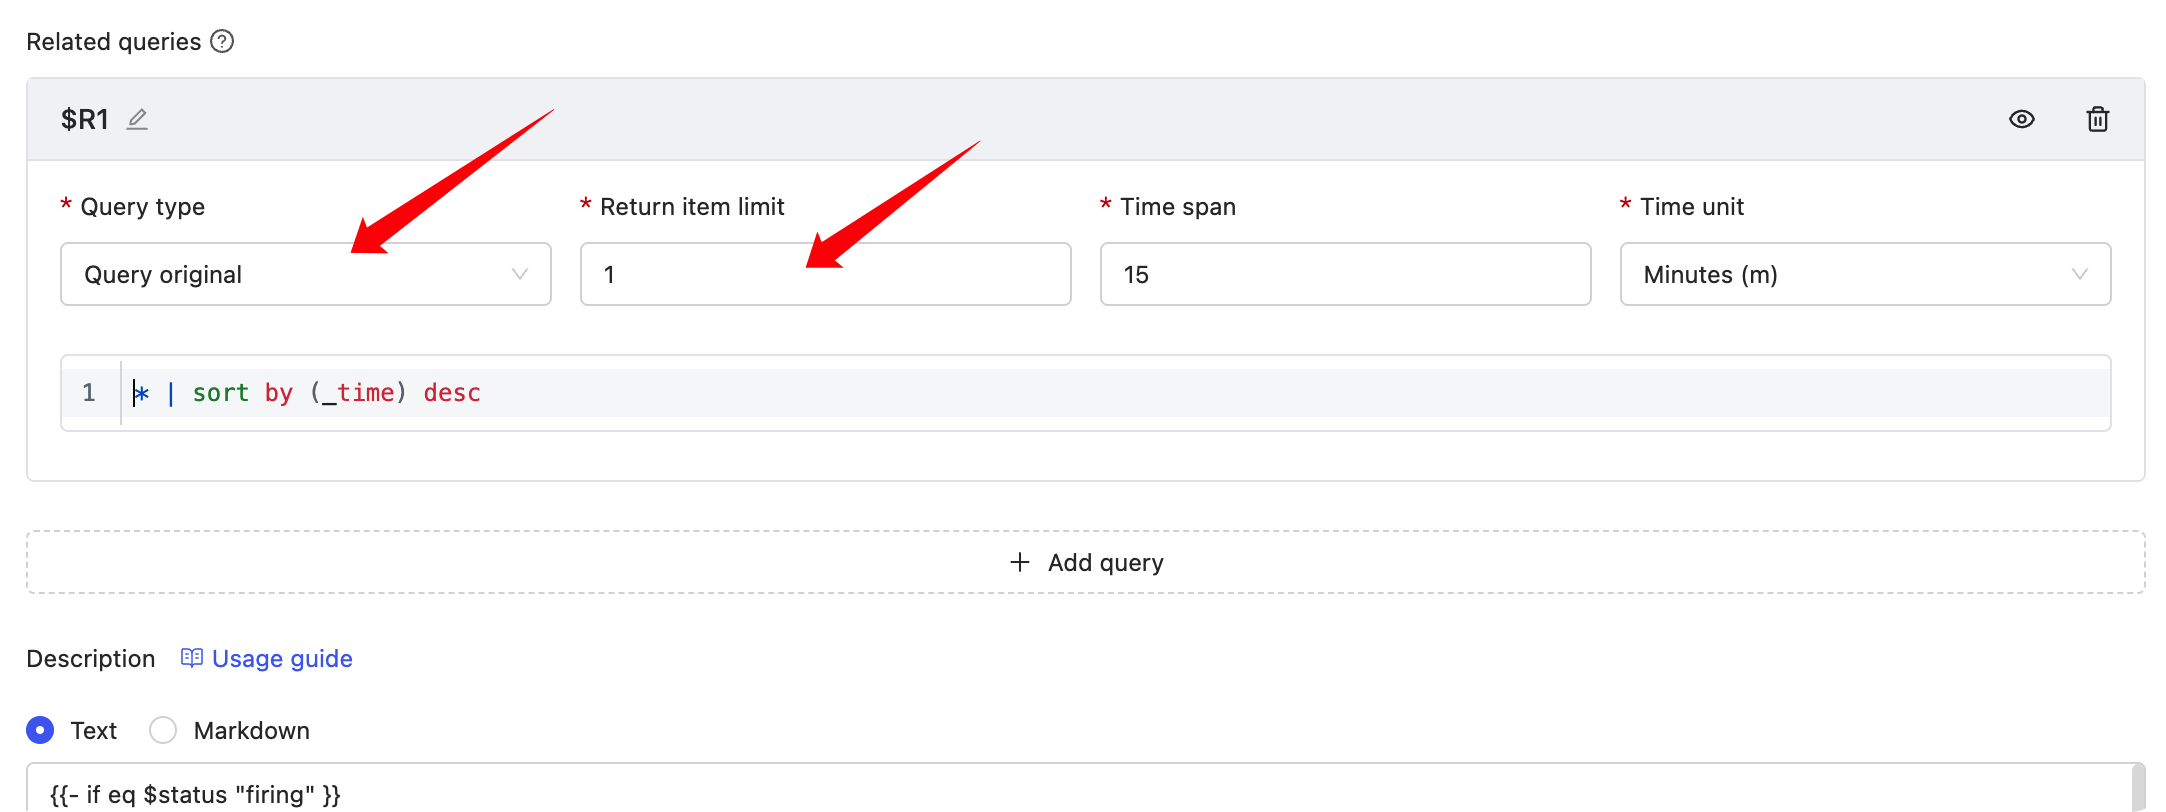
{{- if eq $status "firing" }}
triggered value: {{ $value | printf "%.3f" }}
{{- range $x := $relates.R1}}
{{- range $k, $v := $x.Fields }}
{{- if eq $k "_time" }}
{{ $k }} : {{ timeFormat $v "2006-01-02T15:04:05Z07:00" 8 }}
{{- else }}
{{ $k }} : {{ $v }}
{{- end }}
{{- end }}
{{- end}}
{{- else}}
Recovered
{{- end}}

 微信扫码交流
修改于 2026-01-09 02:59:08