
Grafana Integration
In Flashduty
Using Private Integration
Expand
1.
2.
3.
4.
Using Shared Integration
Expand
1.
2.
3.
Route to configure more routing rules)4.
5.
In Grafana
Legacy Alerting
1.
2.
3.
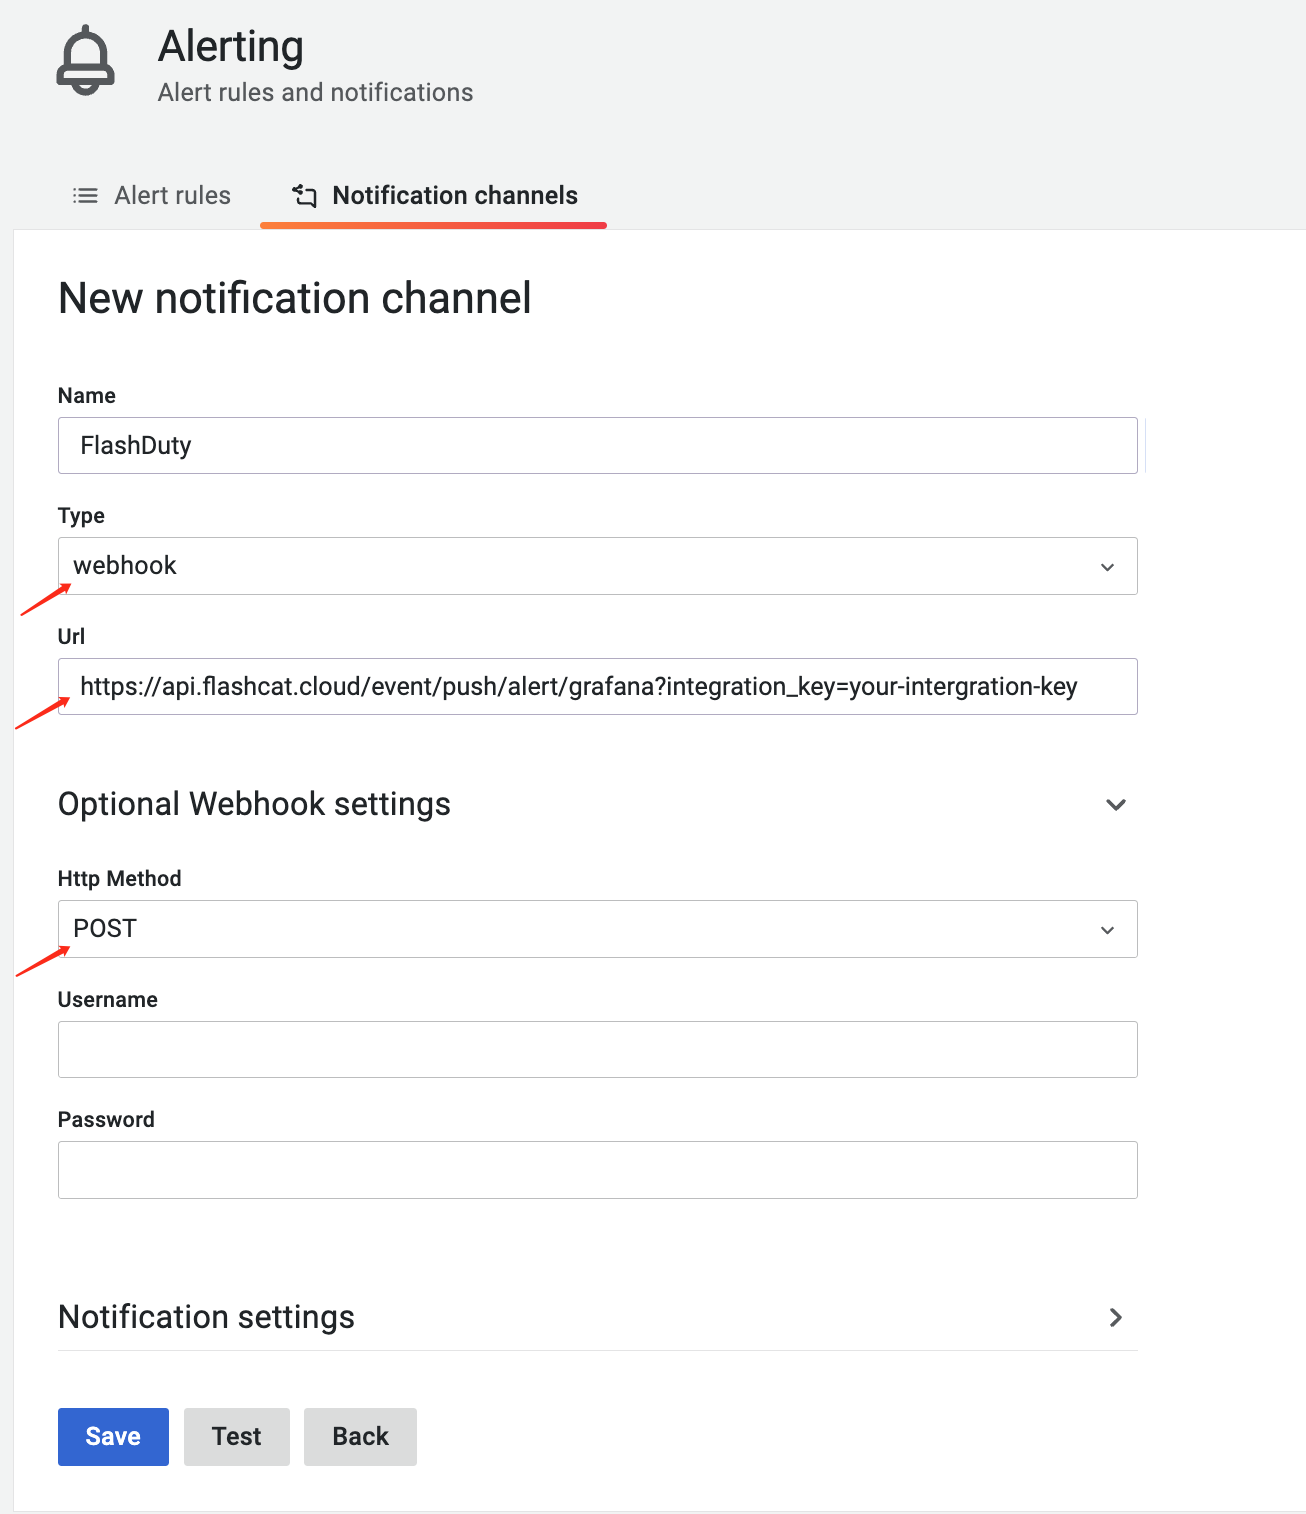
4.
5.
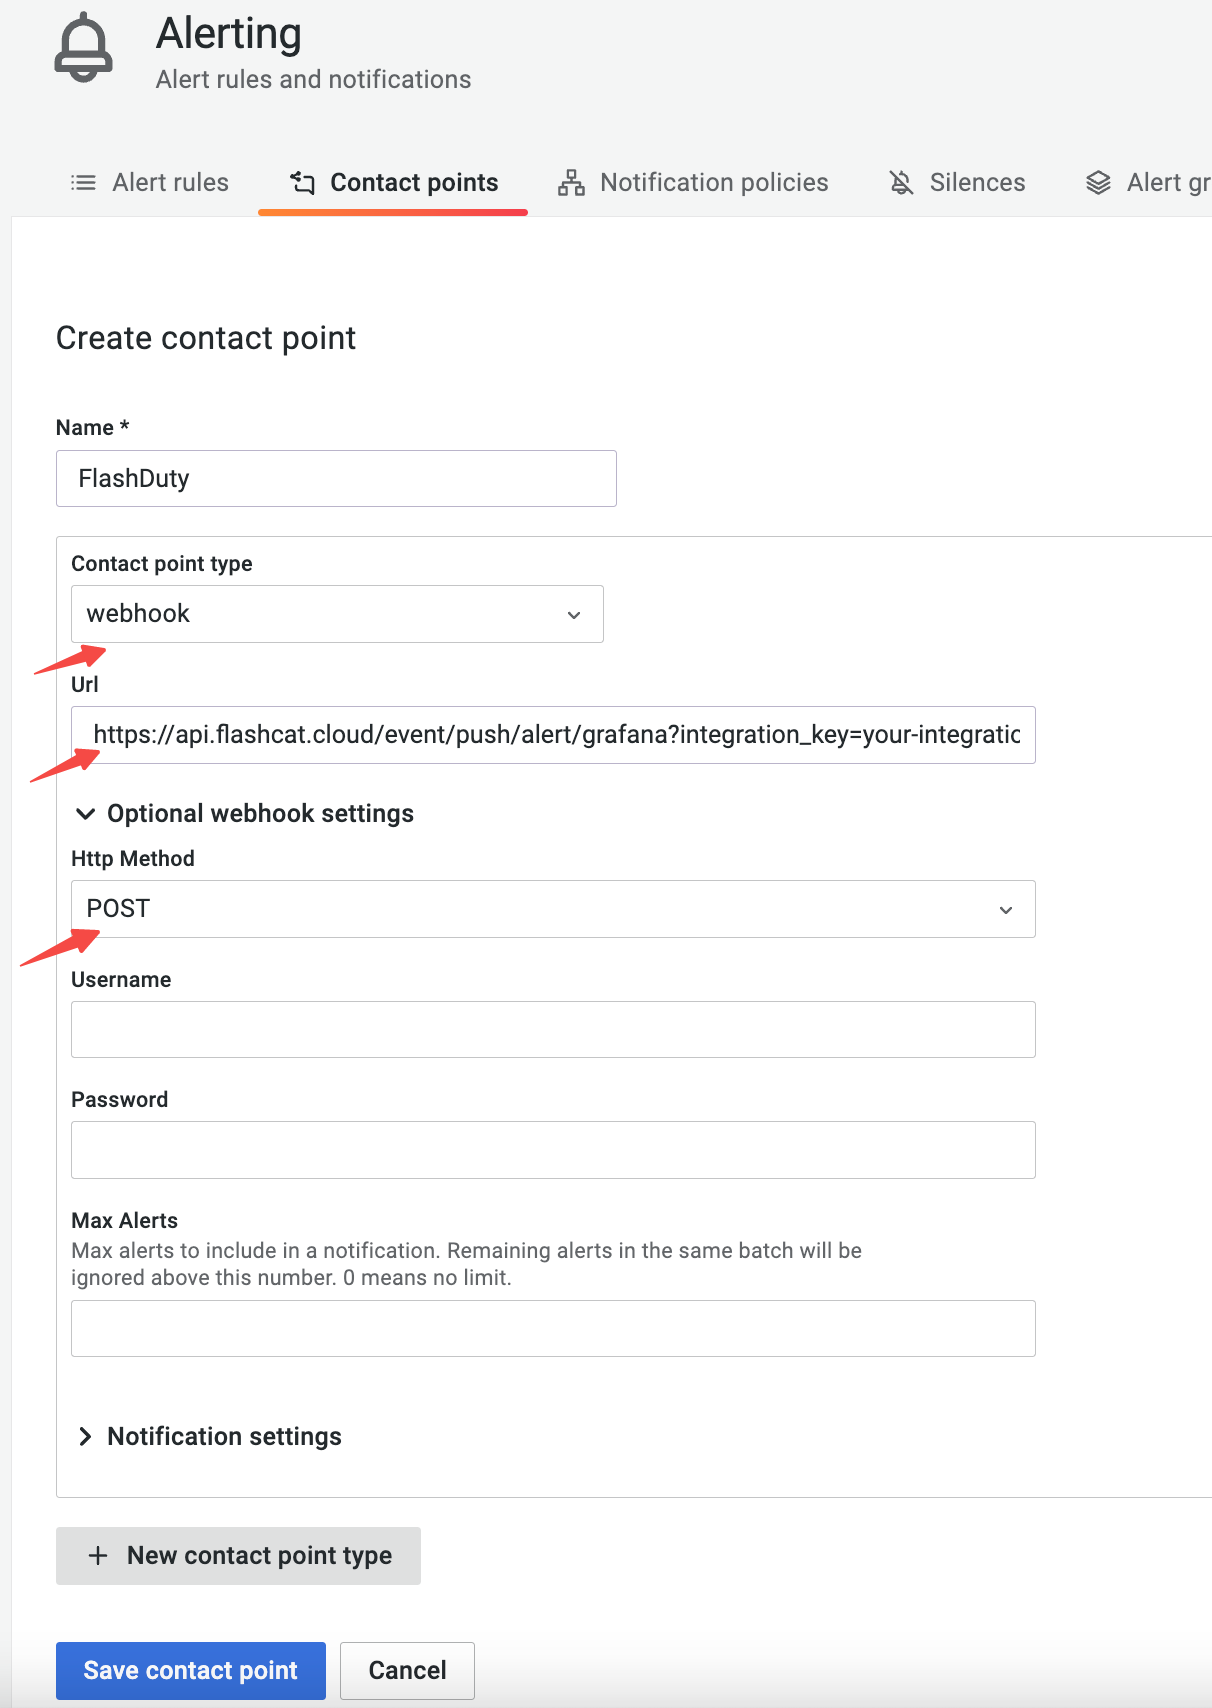
Grafana Alerting
1.
2.
3.
4.
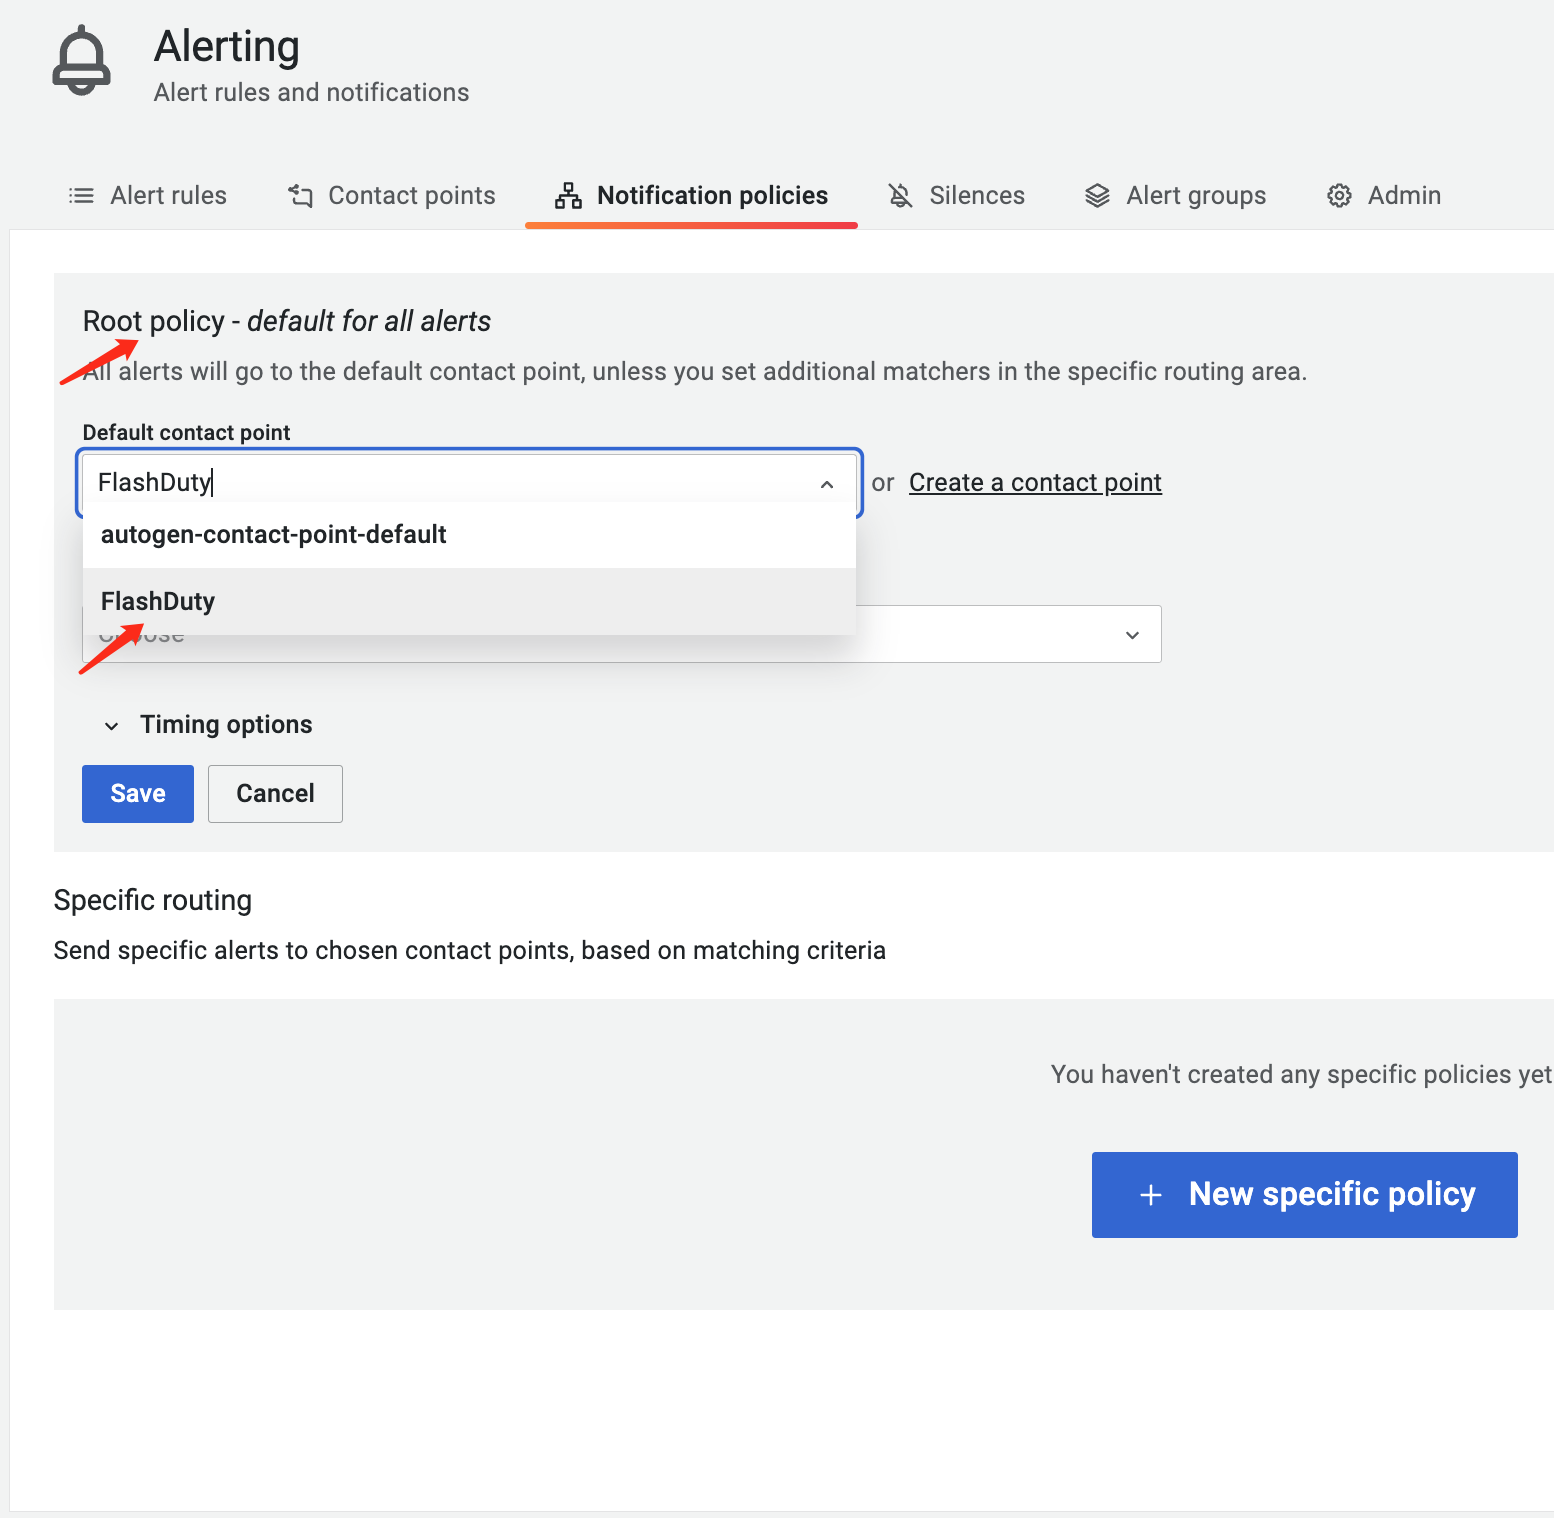
5.
6.
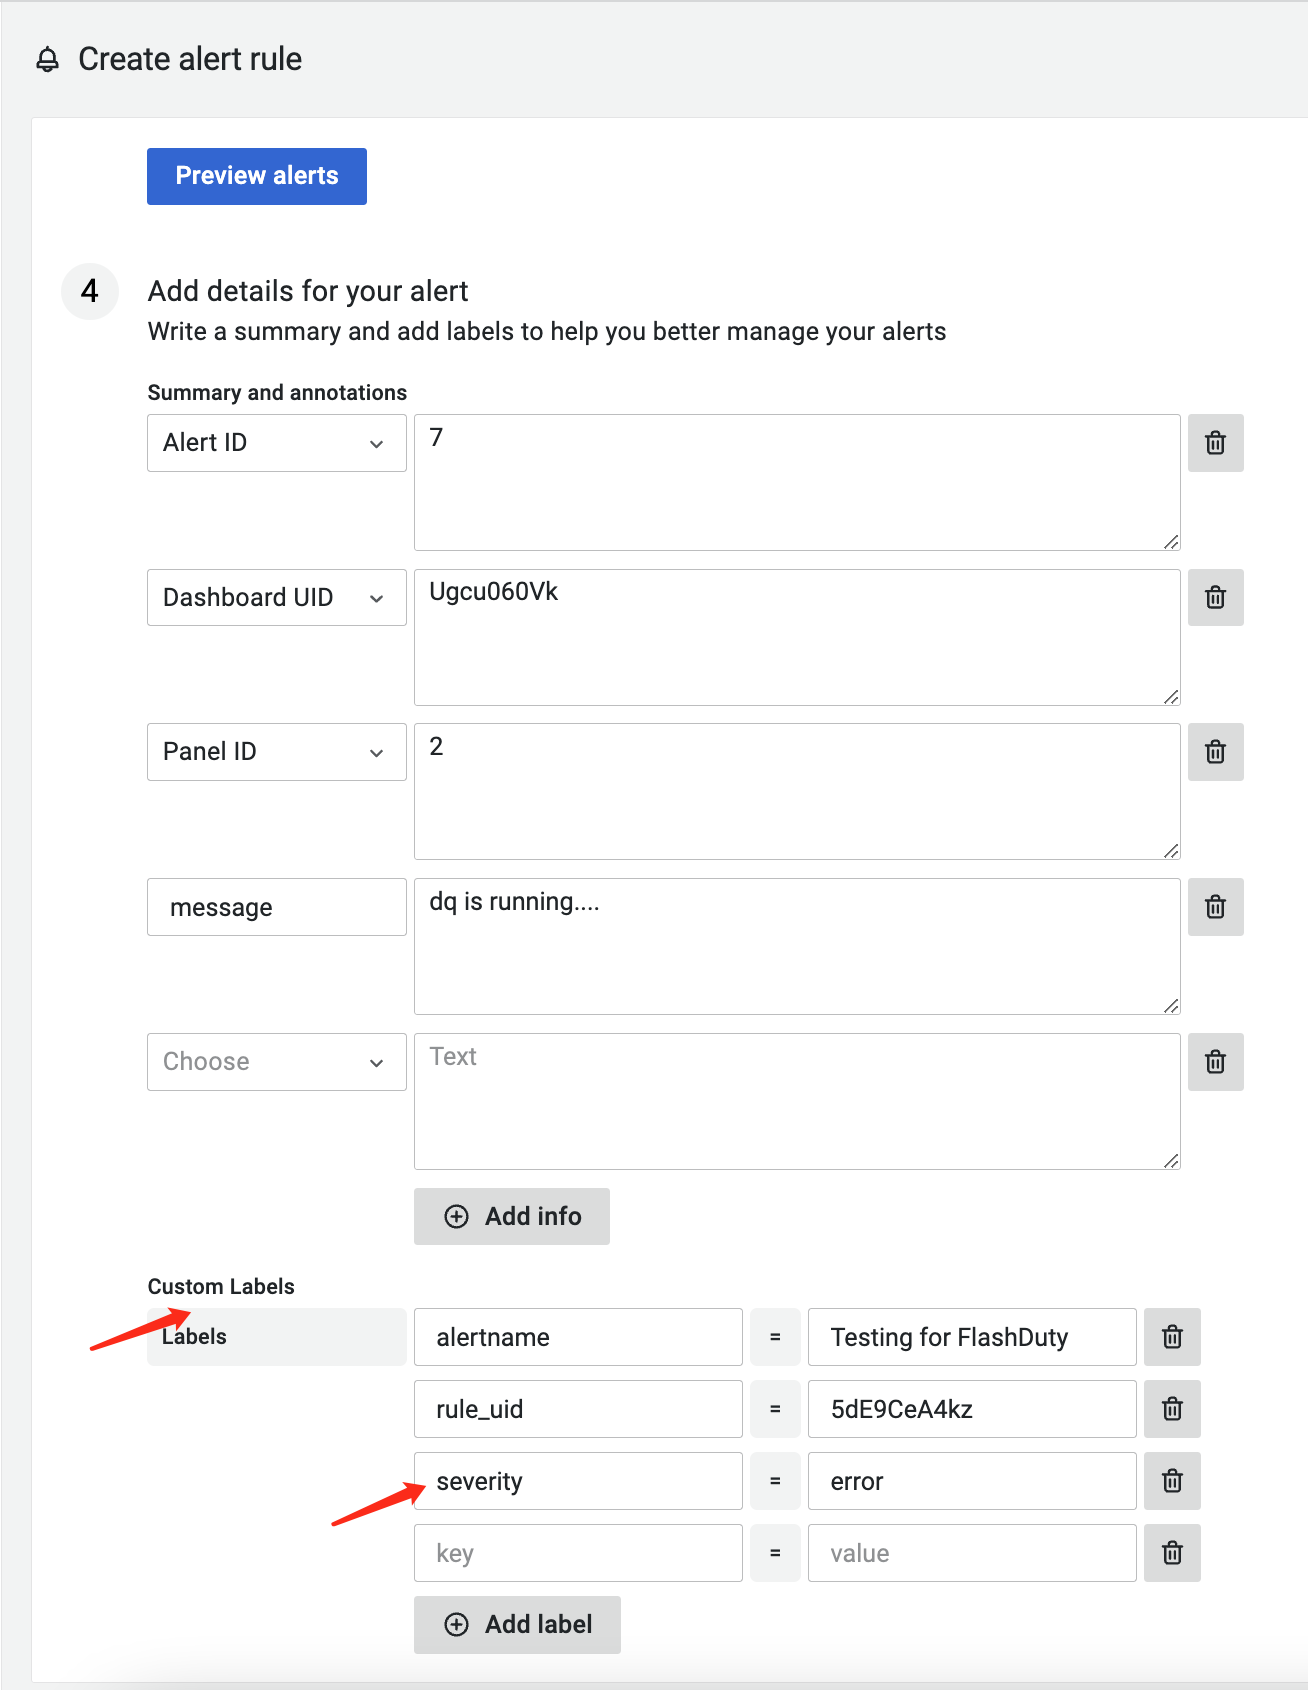
7.
Status Mapping
| Legacy Alerting | Flashduty | Status |
|---|---|---|
| alerting | Warning | Warning |
| no_data | Critical | Critical |
| ok | Ok | Resolved |
severity, priority, and level labels from alert events in sequence. The corresponding value will be used as Prometheus's own alert severity. If none are found, the system automatically sets the Prometheus alert severity to warning.| Grafana Alerting | Flashduty | Status |
|---|---|---|
| critical | Critical | Critical |
| warning | Warning | Warning |
| warn | Warning | Warning |
| info | Info | Info |
| acknowledged | Info | Info |
| unknown | Info | Info |
| unk | Info | Info |
| ok | Ok | Resolved |


 微信扫码交流
修改于 2025-03-27 07:44:35