
Quick Start
monitedge, create data sources, and create alert rules.1. Install monitedge
monitedge needs to be deployed within users' private networks, responsible for synchronizing alert rules from SaaS, performing periodic data source queries and threshold evaluation, generating alert events and pushing them to the SaaS side. To experience alerting functionality, you must first install monitedge.monitedge instances with the same Engine Cluster Name will form a cluster, jointly sharding the processing of alert rules to avoid single point of failure risks. If you only plan one set of monitedge clusters, the engine cluster name can maintain the default default; if you plan multiple sets of monitedge clusters, such as one set for the East US data center and one set for the South China data center, please specify different engine cluster names for each set of clusters.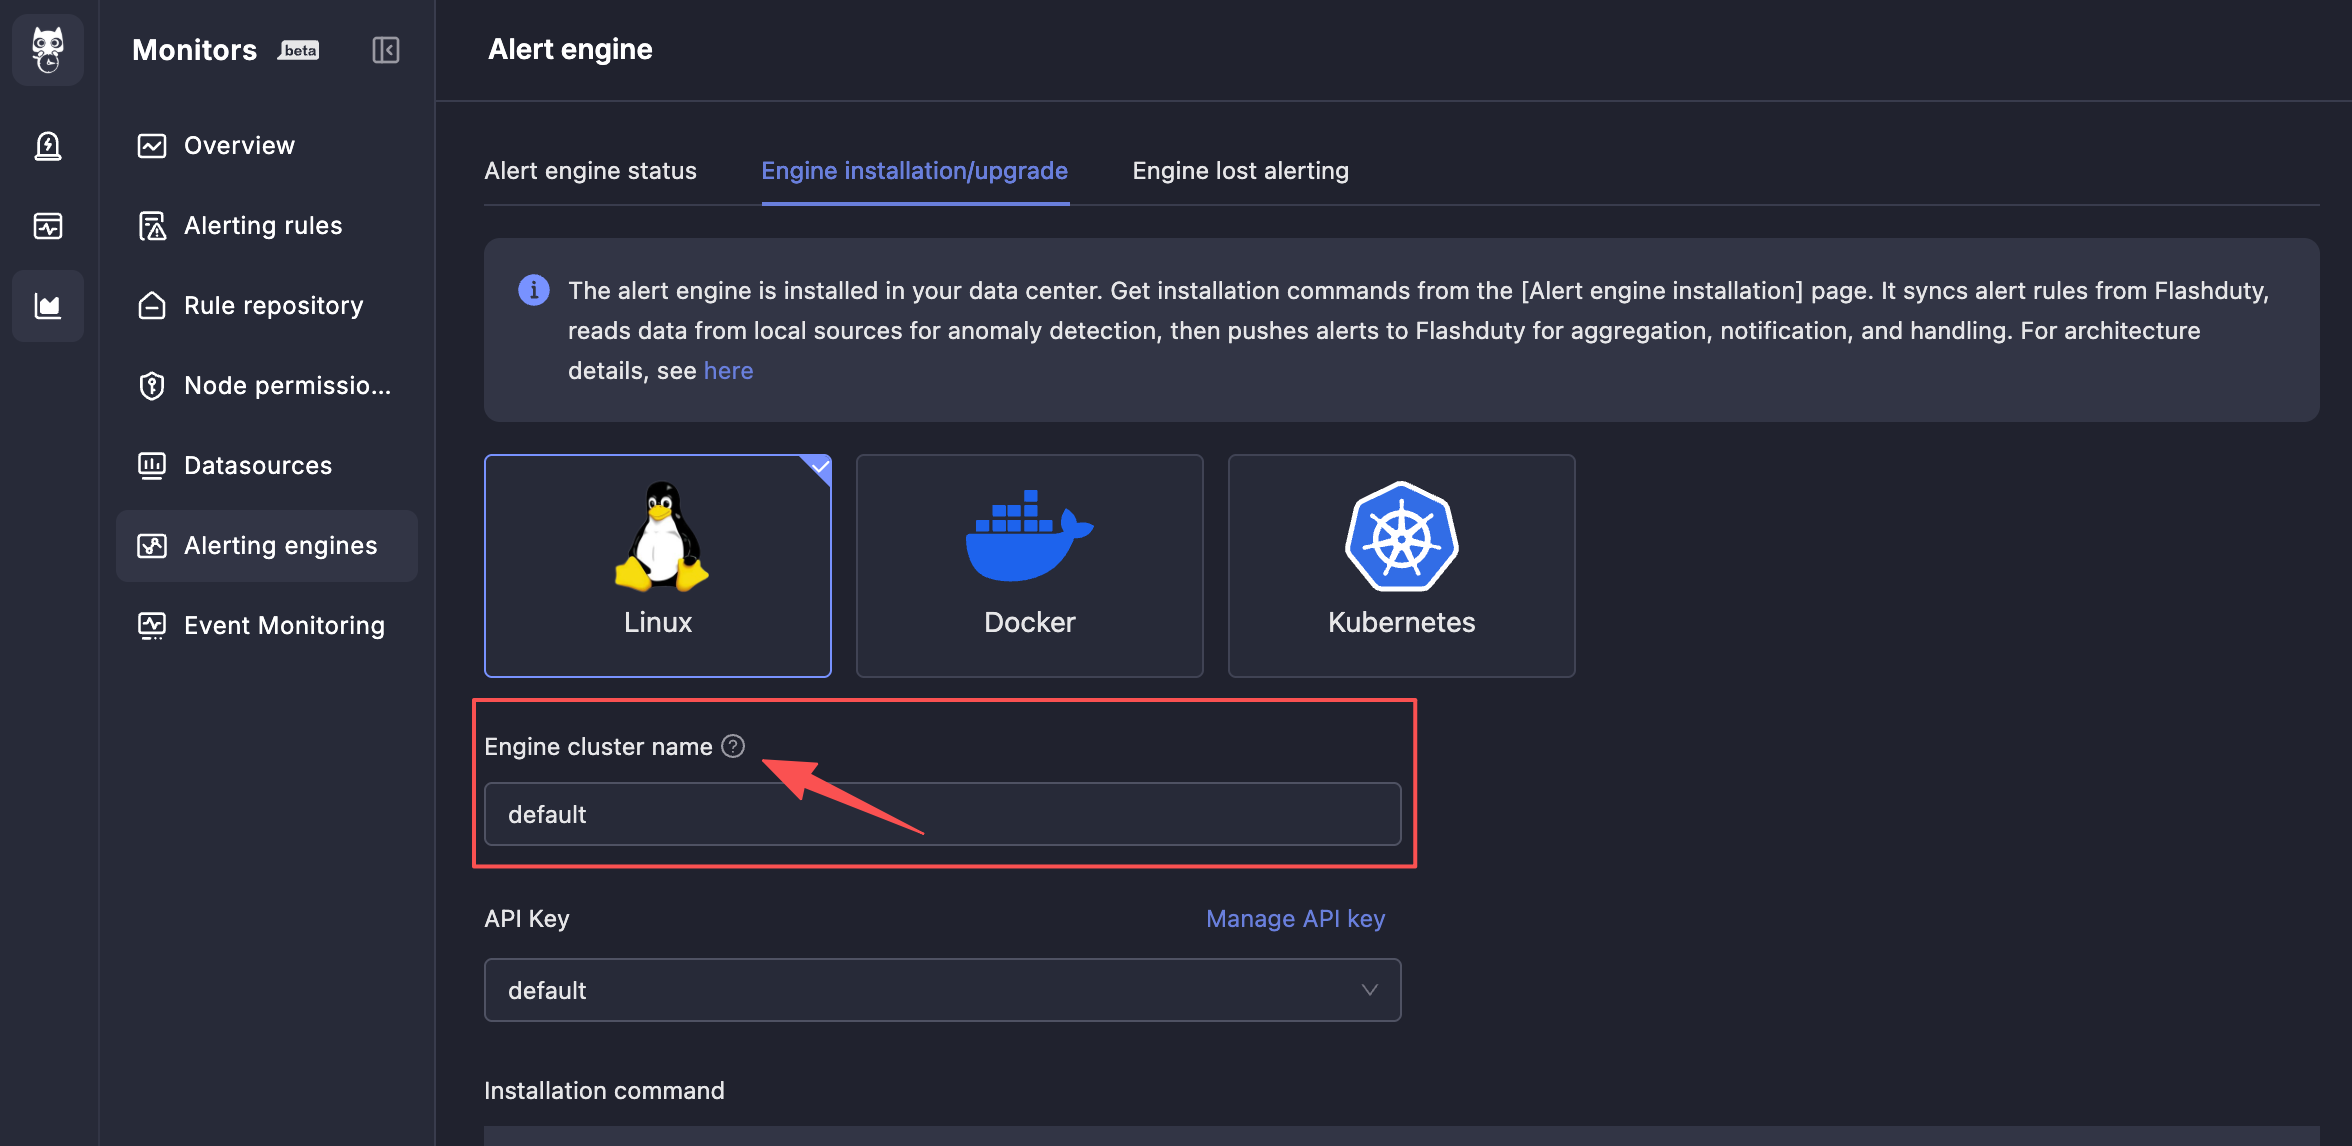
Alert Engine Status
monitedge is installed, it will automatically connect to the SaaS side and periodically synchronize alert rules. You can view the current alert engine status information on the alert engine status page.Engine Disconnection Alerts
monitedge) fails, the impact is significant. Therefore, engine disconnection alerts are provided to promptly issue alert notifications when the engine fails. For engine clusters composed of multiple instances, as long as one instance in the cluster is alive, engine disconnection alerts will not be triggered because the cluster can still work normally.2. Create Data Sources
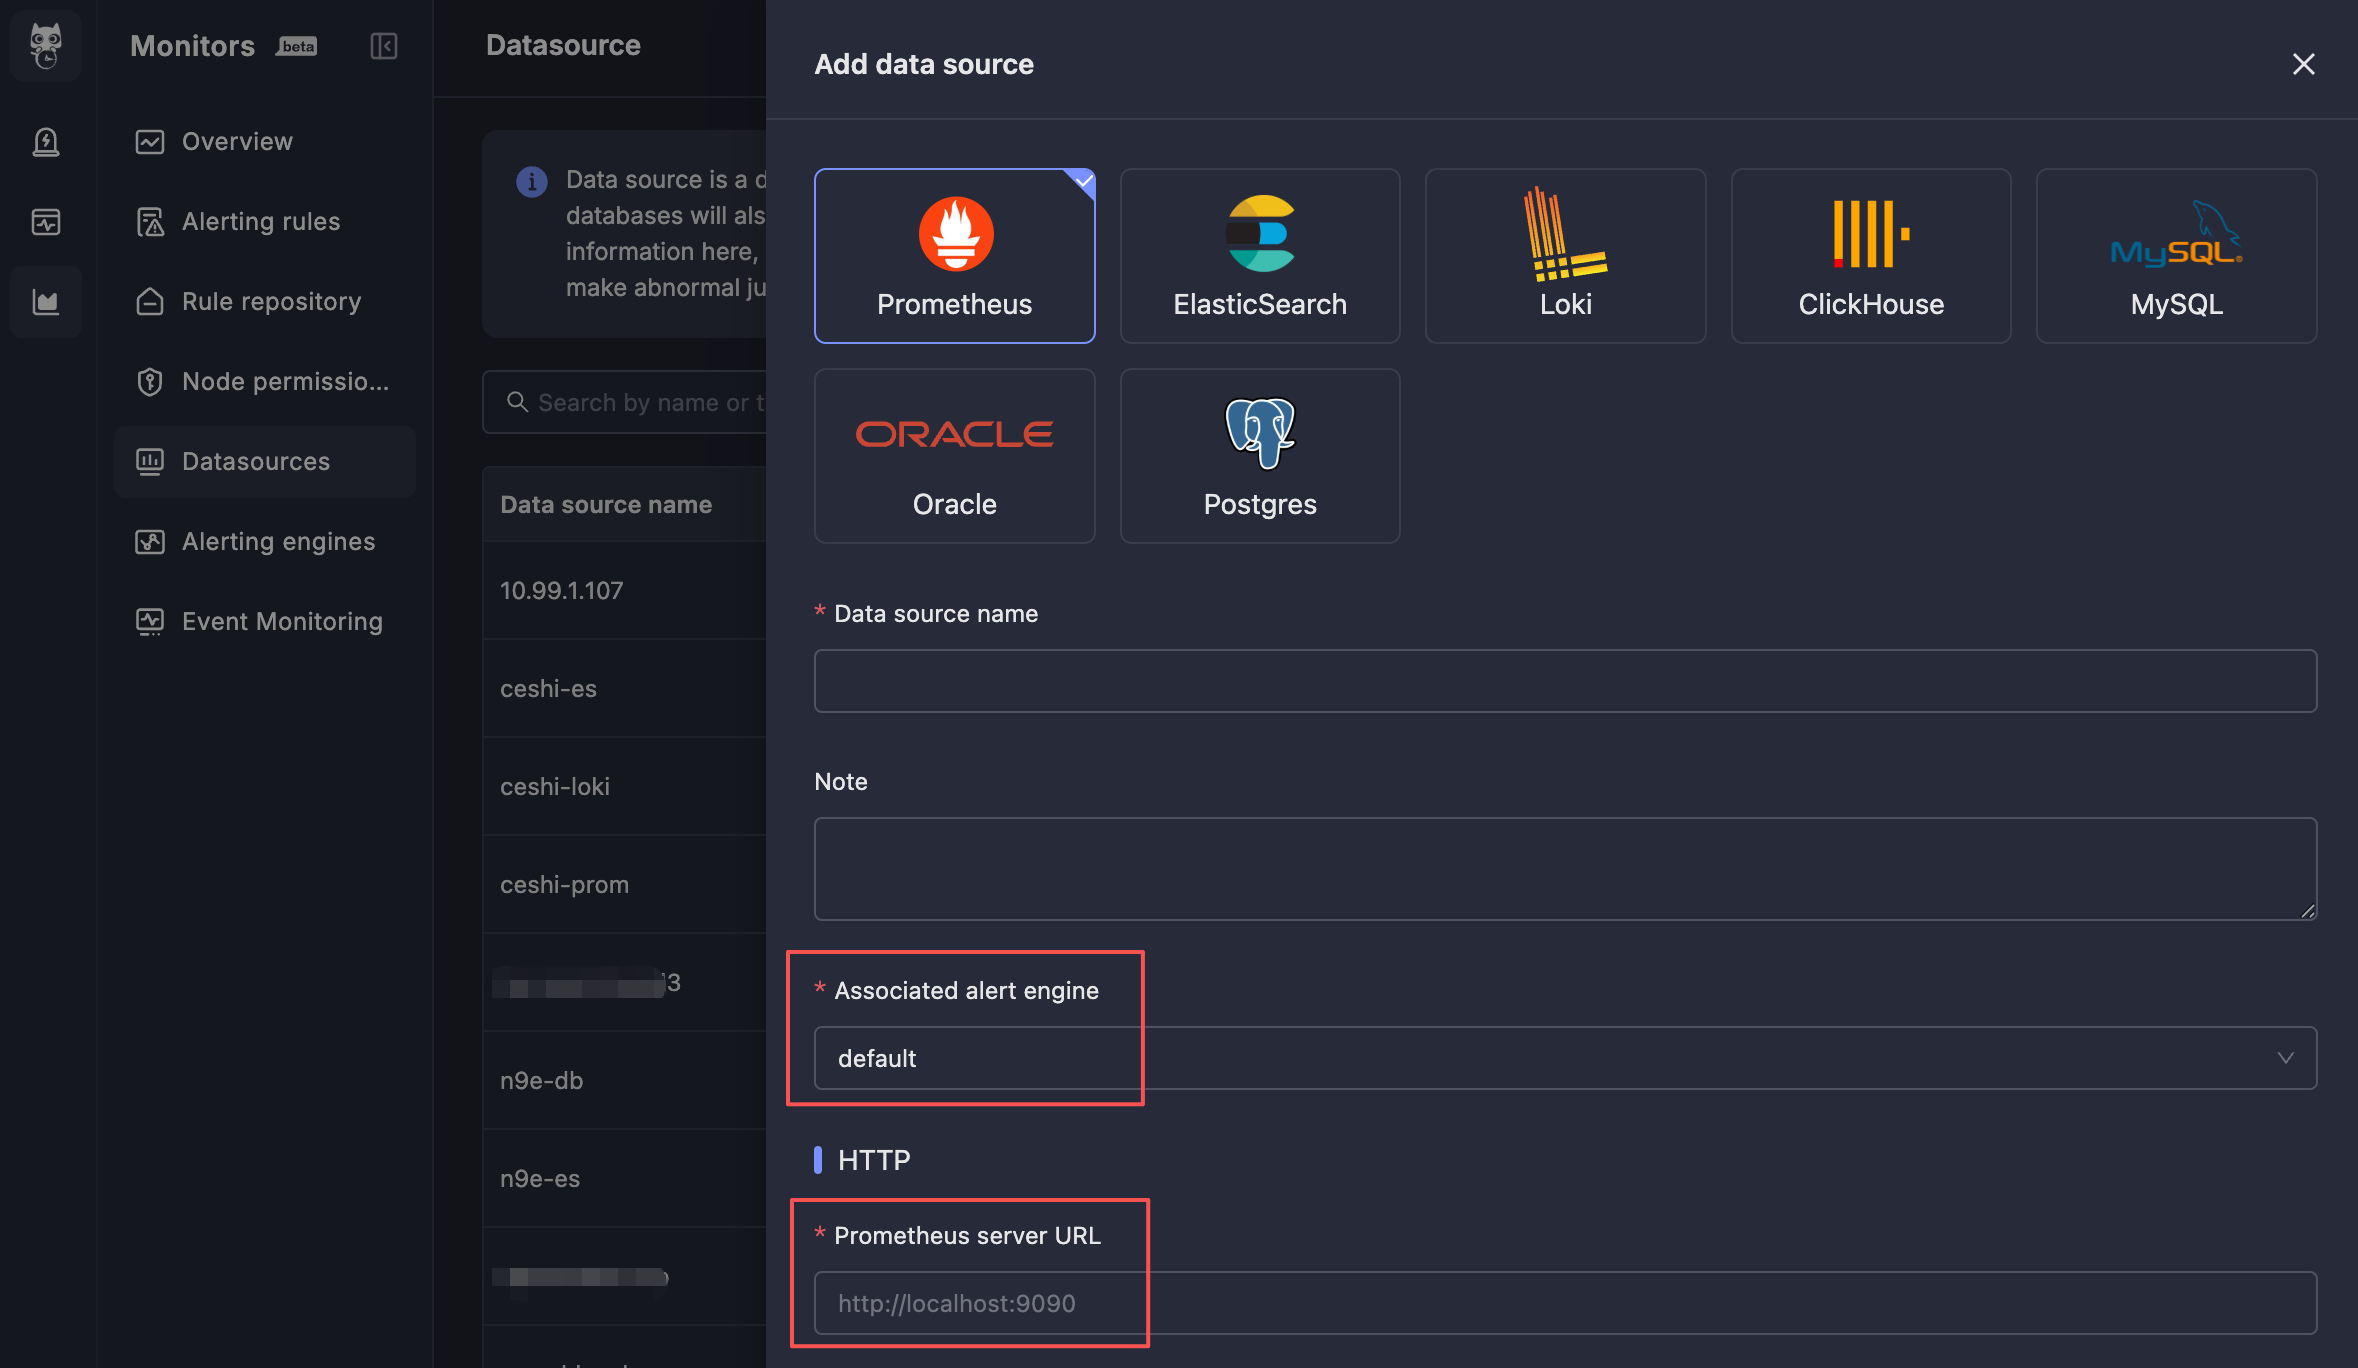
monitedge to connect to, and must be an address that monitedge can access. Usually, this is an internal network address.3. Create Alert Rules
Basic Configuration
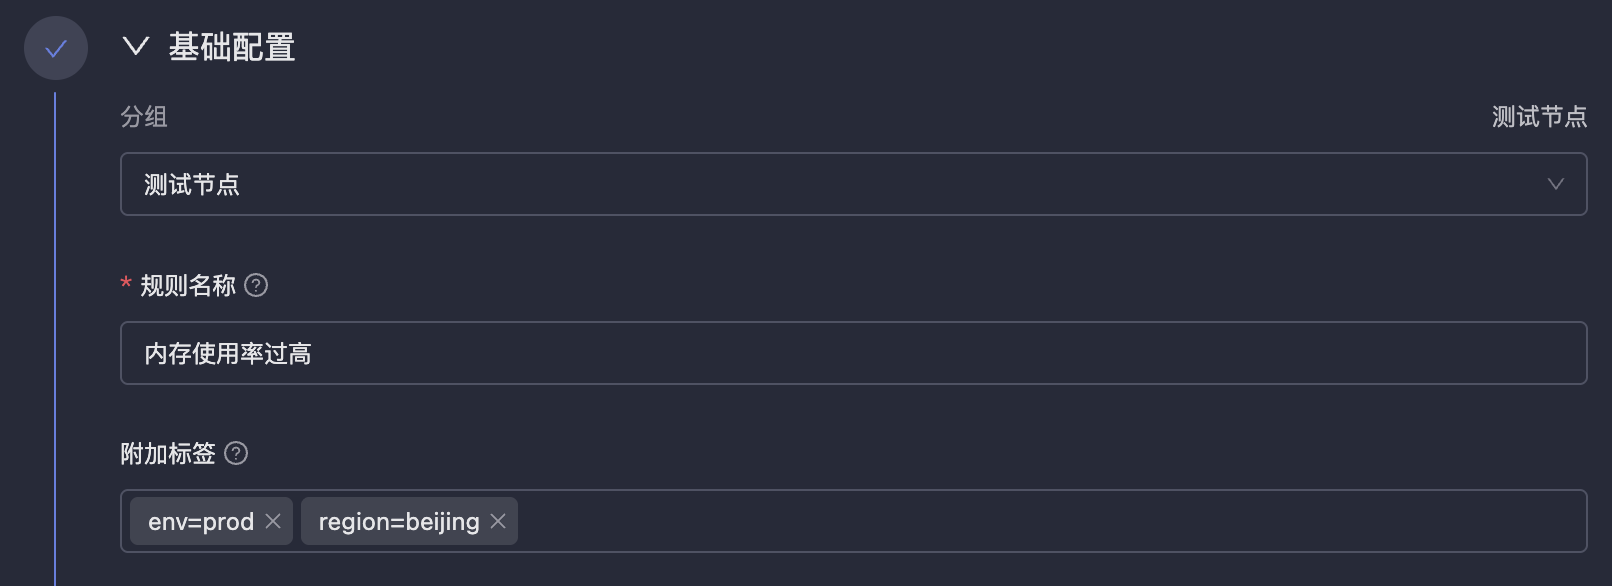
labels in Prometheus alert rules, they will be attached to all alert events generated by this rule, facilitating filtering, routing, inhibition and other operations in On-call.Data Source Selection
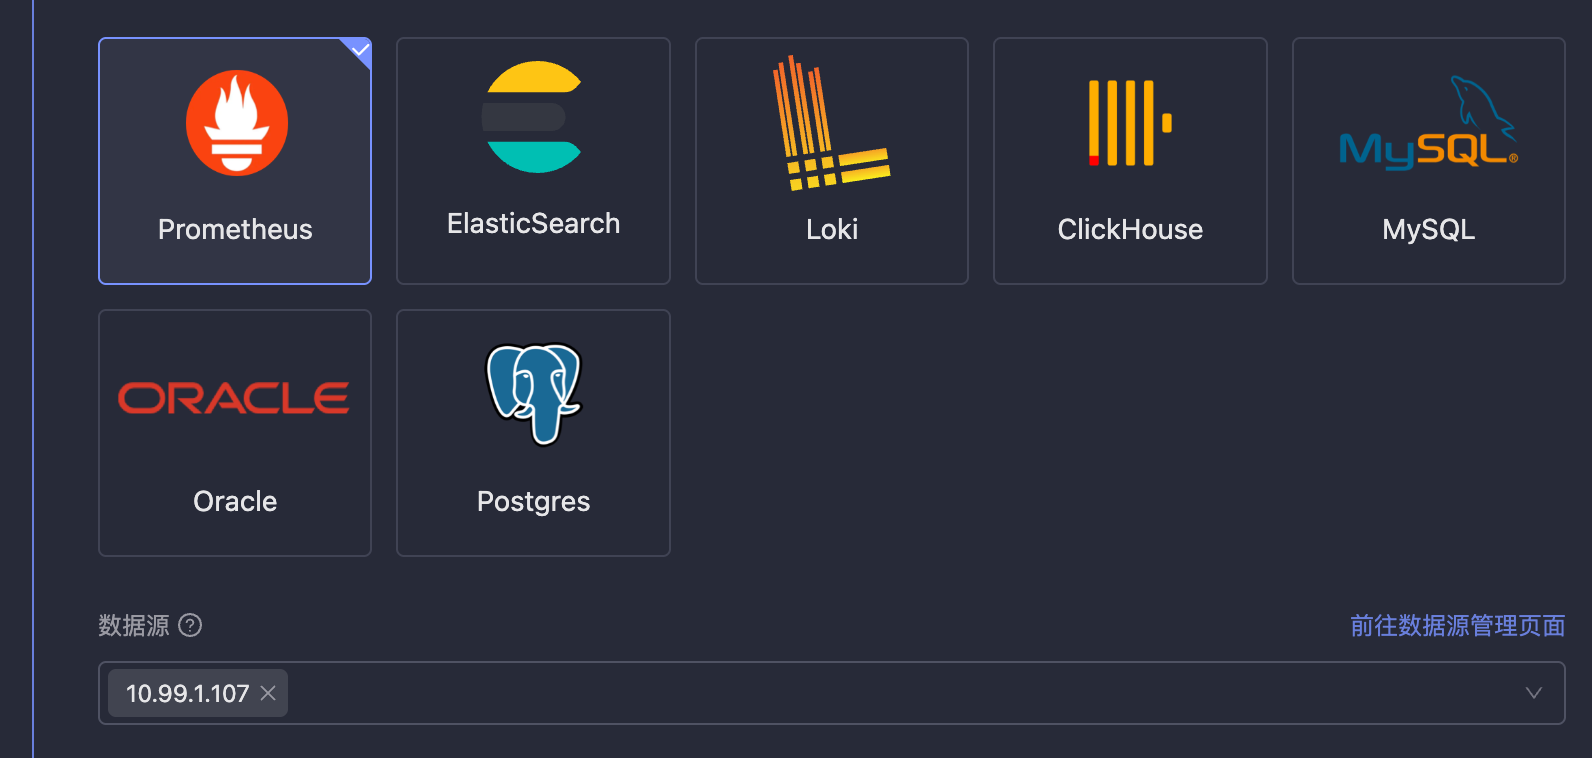
db-*, indicating that this rule will apply to all data sources whose names start with db-.⚠️ Note: Because wildcards need to be supported here for data sources, data source names are stored instead of data source IDs. If the data source name is modified, it will affect the effectiveness of alert rules. Please be cautious when modifying data source names.
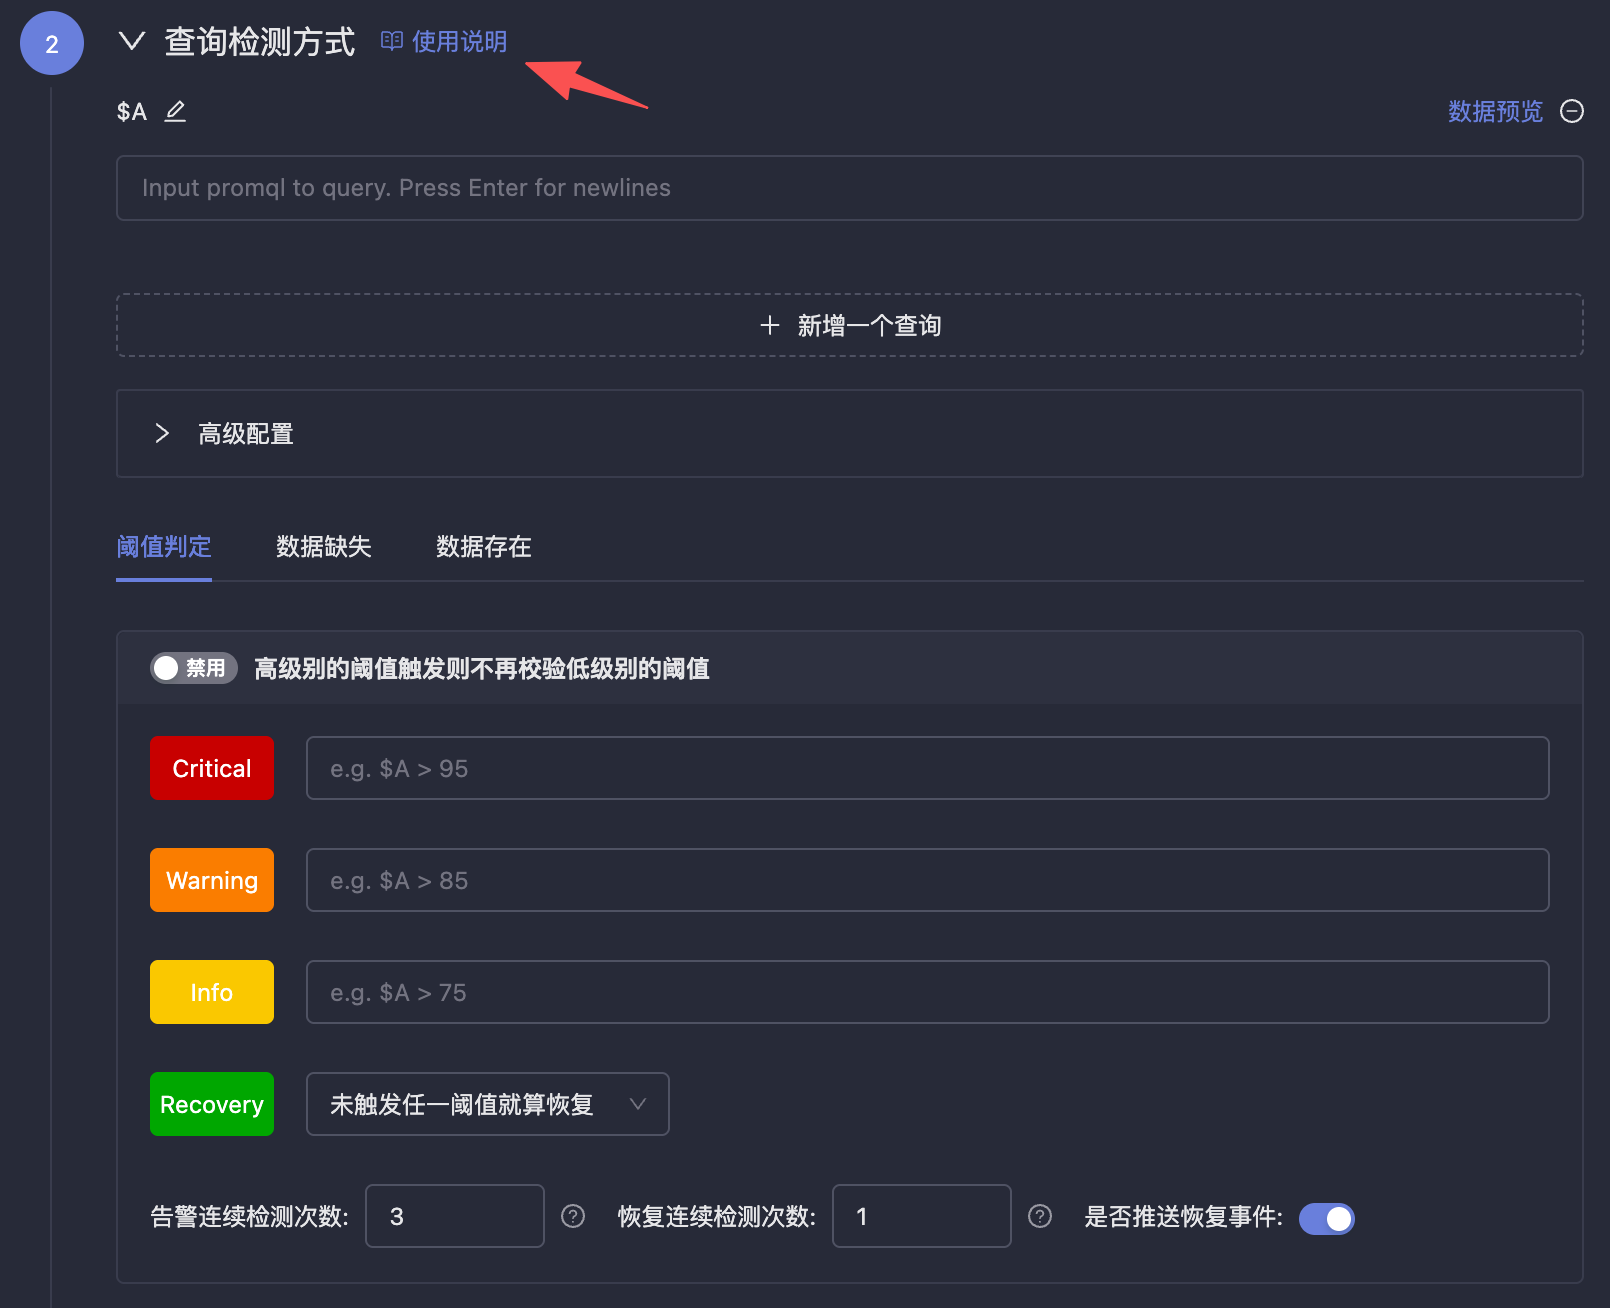
Query Detection Method
Detection Frequency & Effective Time
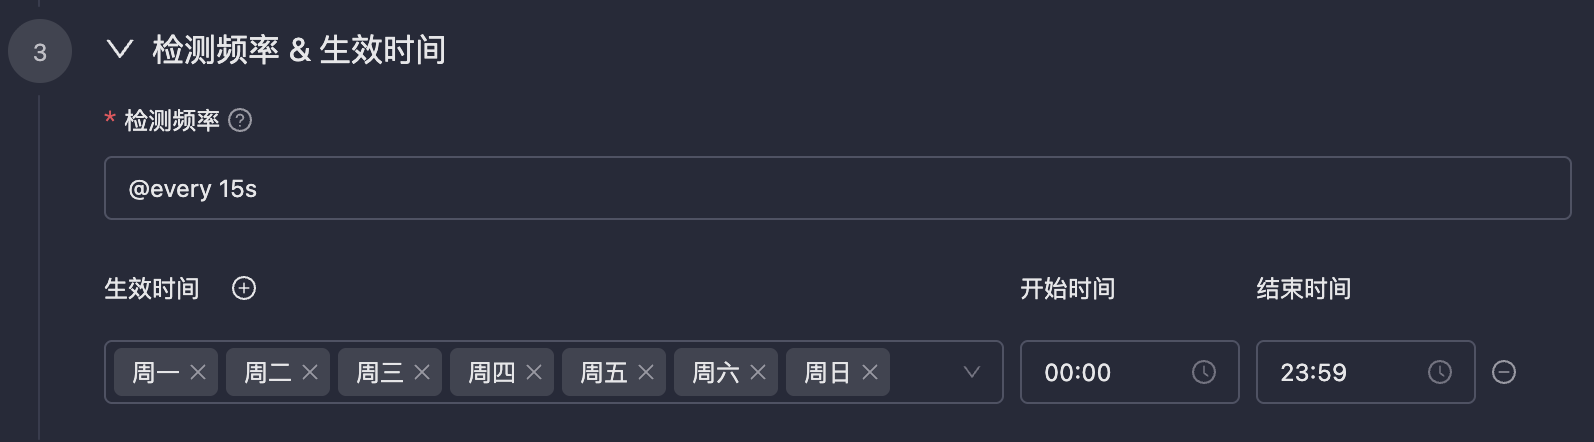
cron expressions. The cron expressions in Monitors are accurate to the second.Event Configuration
annotations in Prometheus alert rules, they will be attached to all alert events generated by this rule, such as attaching dashboard URLs, SOP URLs, etc.⚠️ Note: The maximum number of notifications does not represent the number of message reminders received by end users. Because alert events generated by Monitors will be delivered to On-call, On-call may perform aggregation and noise reduction processing on alert events. The final number of message reminders sent to end users depends on On-call configuration.
4. Results
Triggered.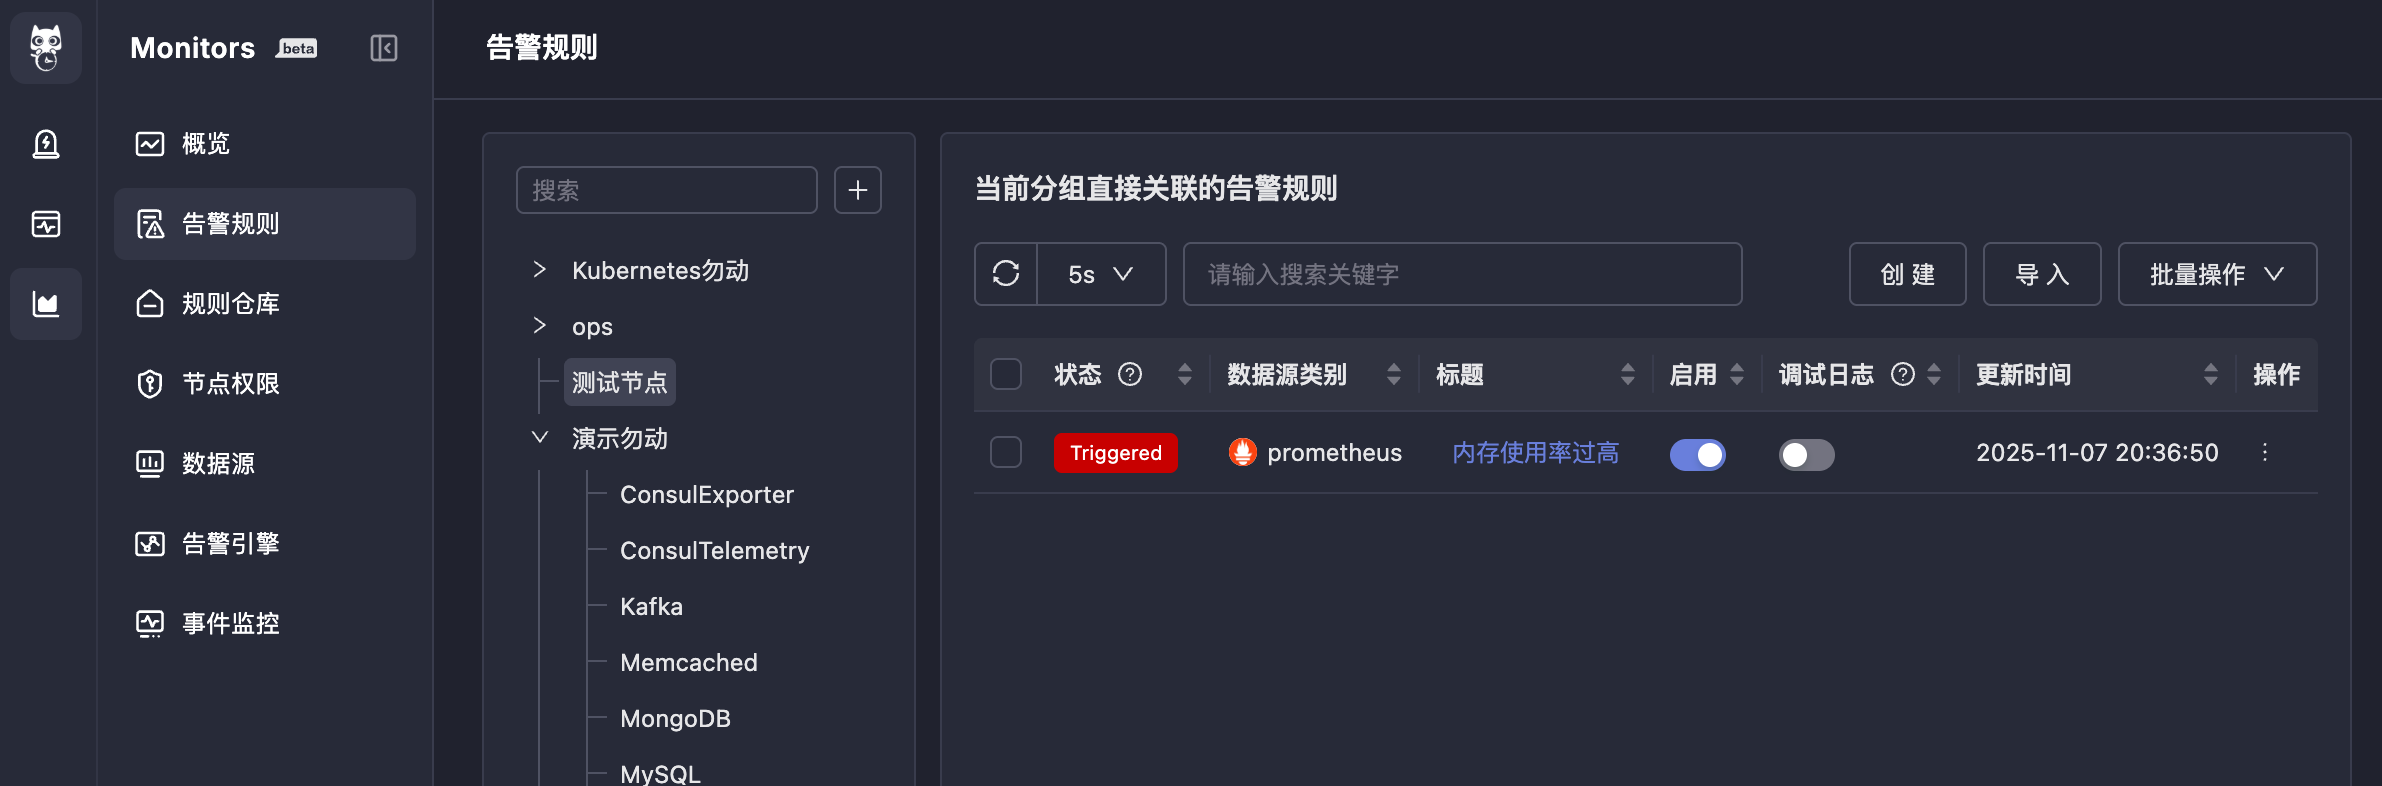
Triggered will show the alert events generated by this rule (you can also view them in On-call):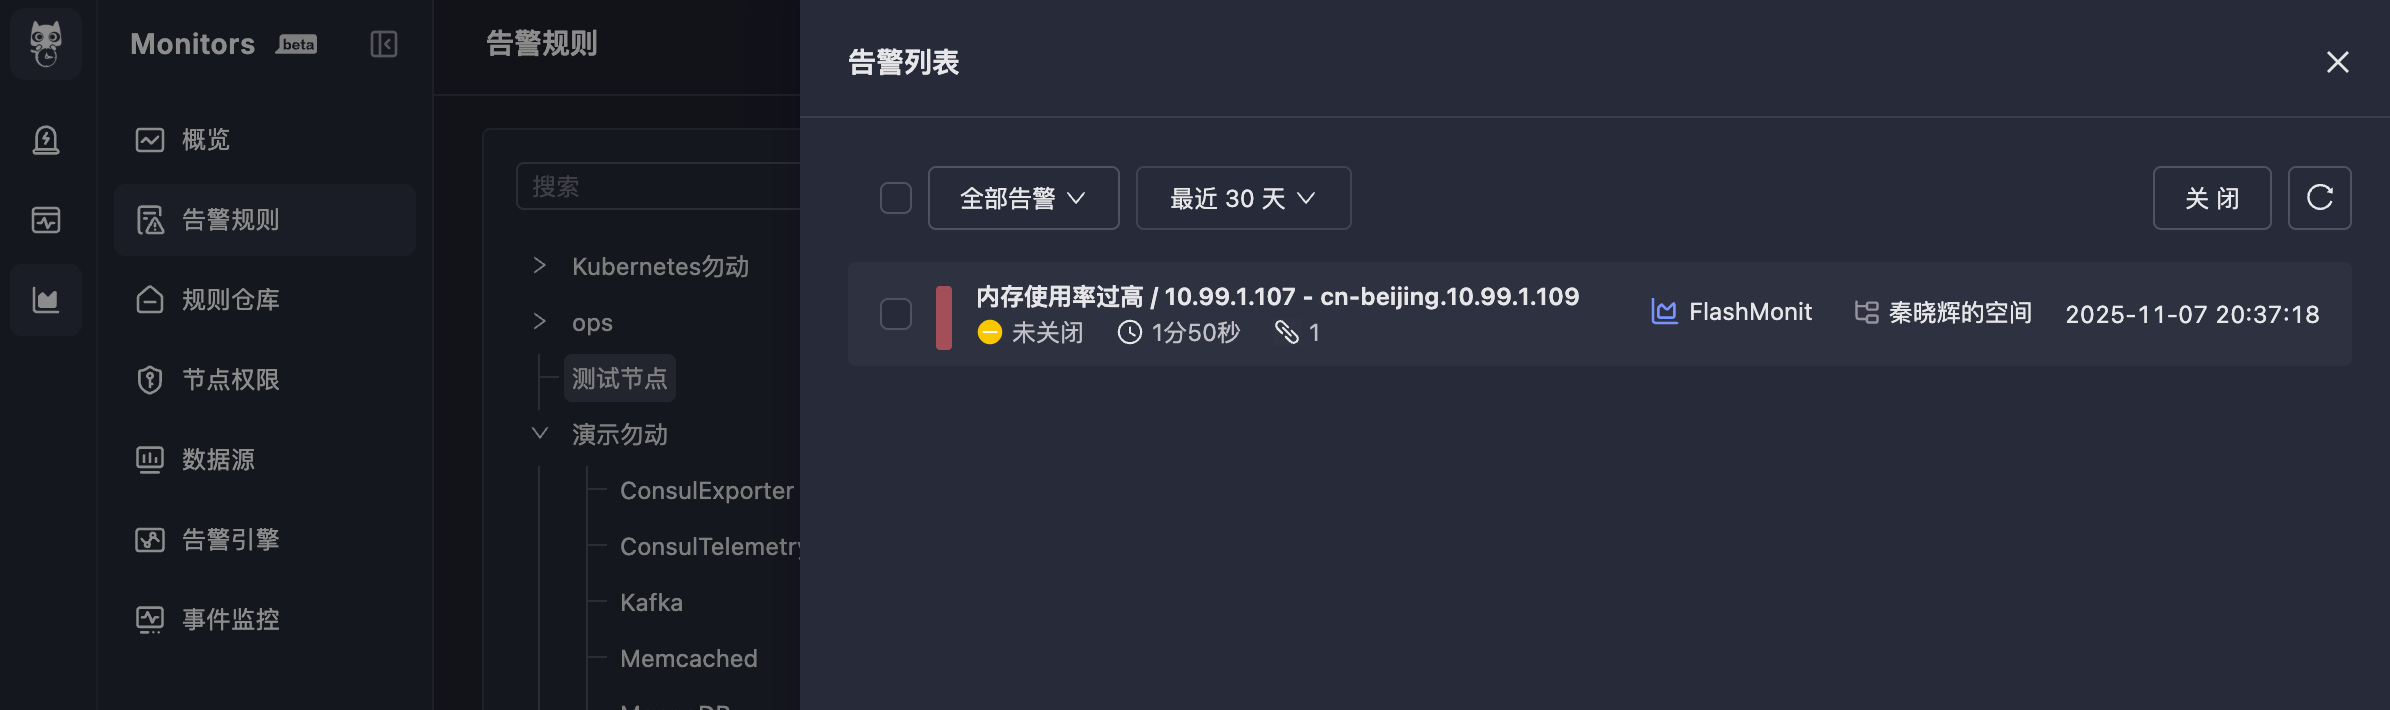
5. Import Alert Rules
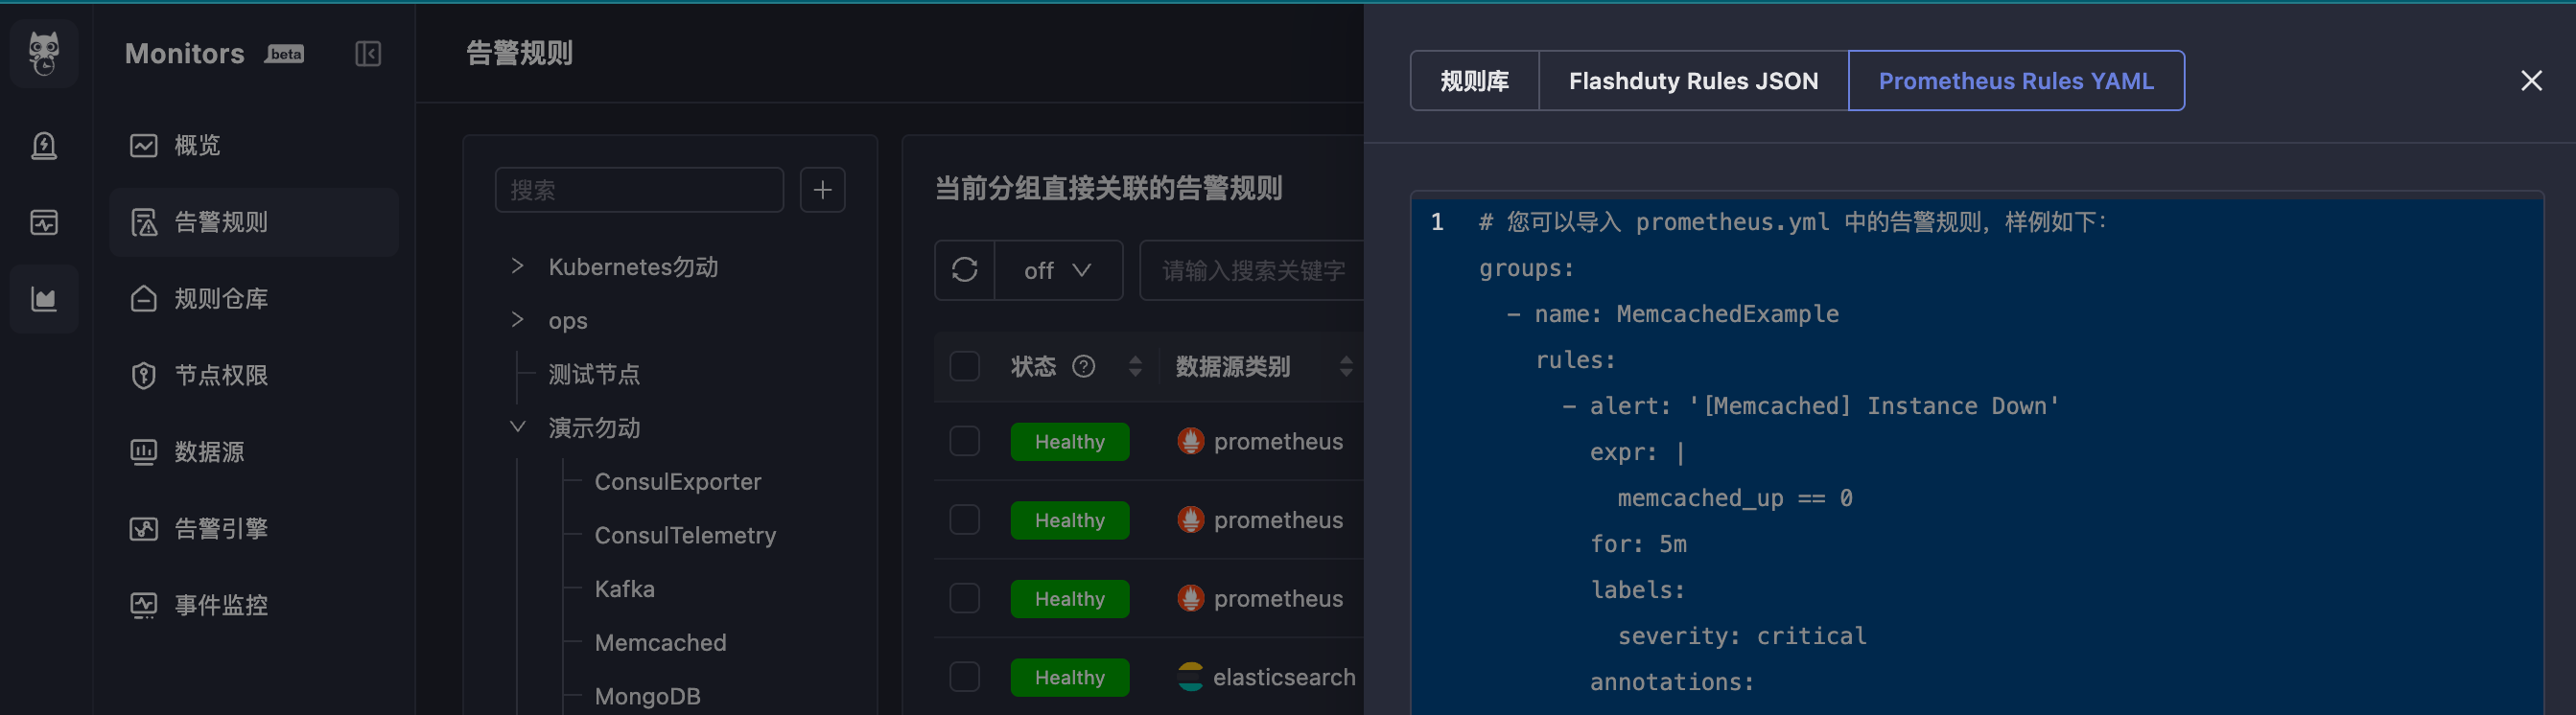
groups as the root node. The YAML indentation must be correct, otherwise the import will fail.

 微信扫码交流
修改于 2025-11-08 06:21:29