
Performance Optimize
Flashduty RUM Performance Issue Diagnosis Guide
Overview
Diagnosis and Optimization
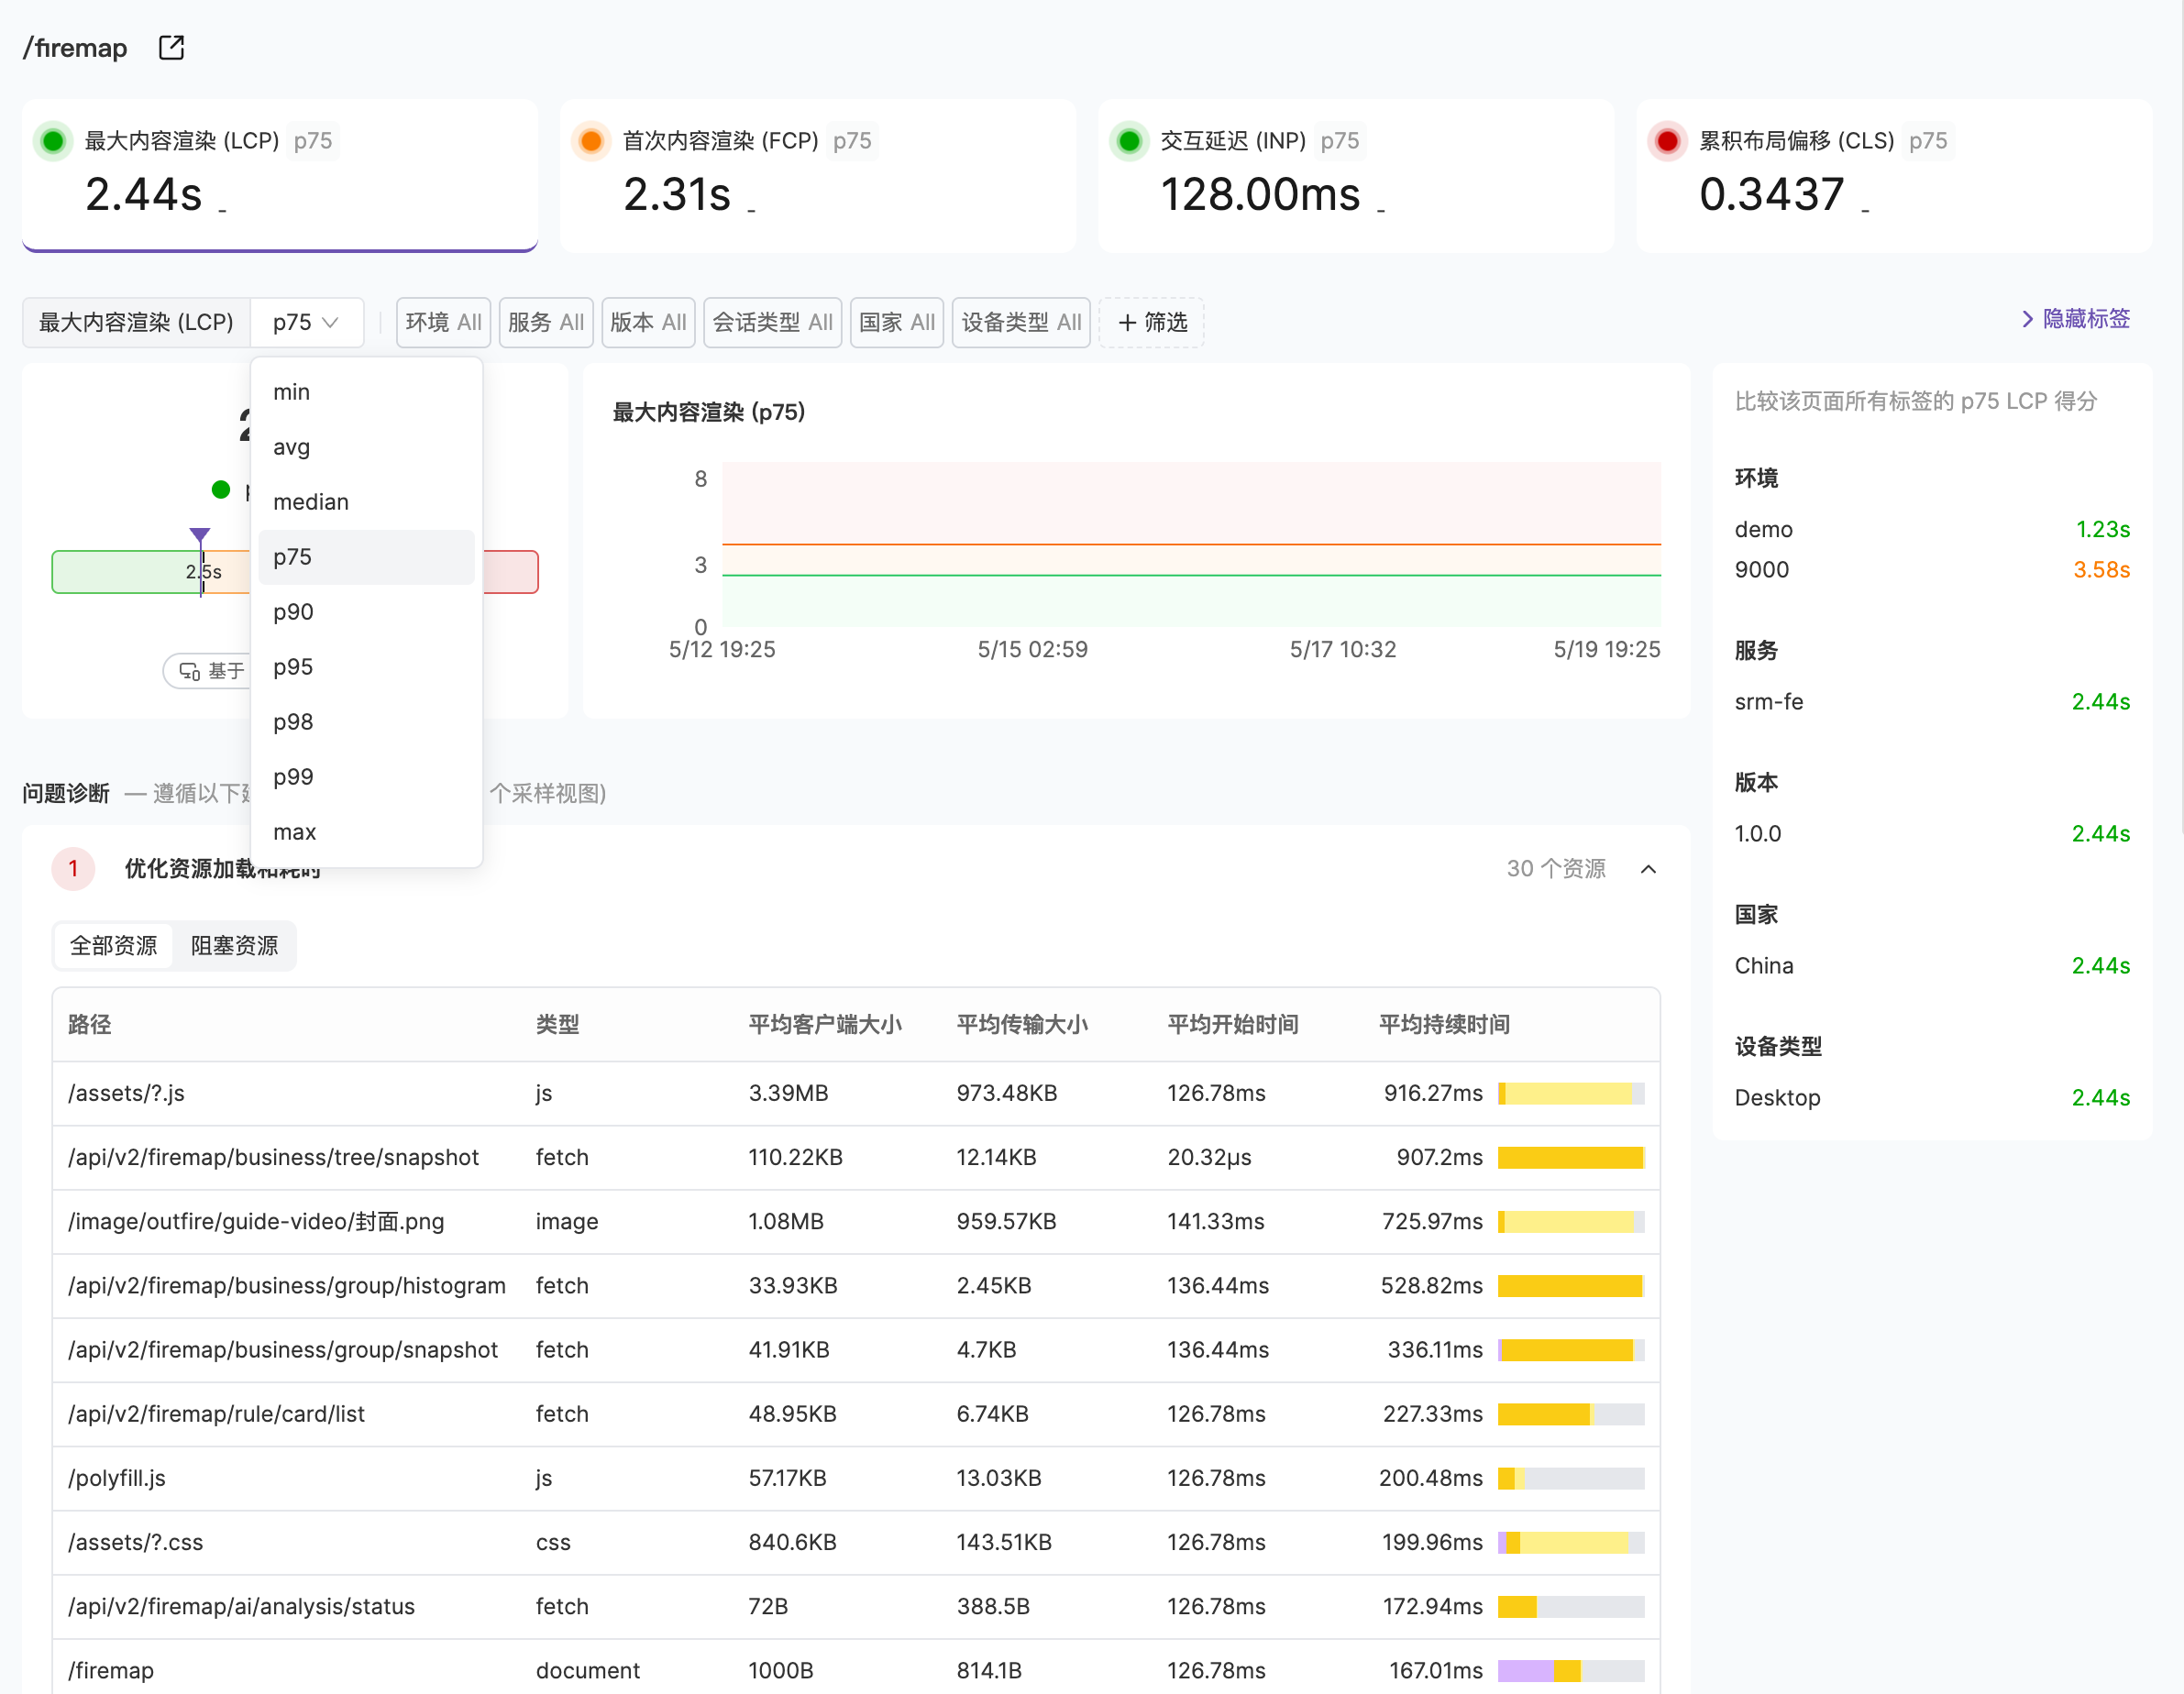
Metric Selection
1.
2.
3.
Data Viewing
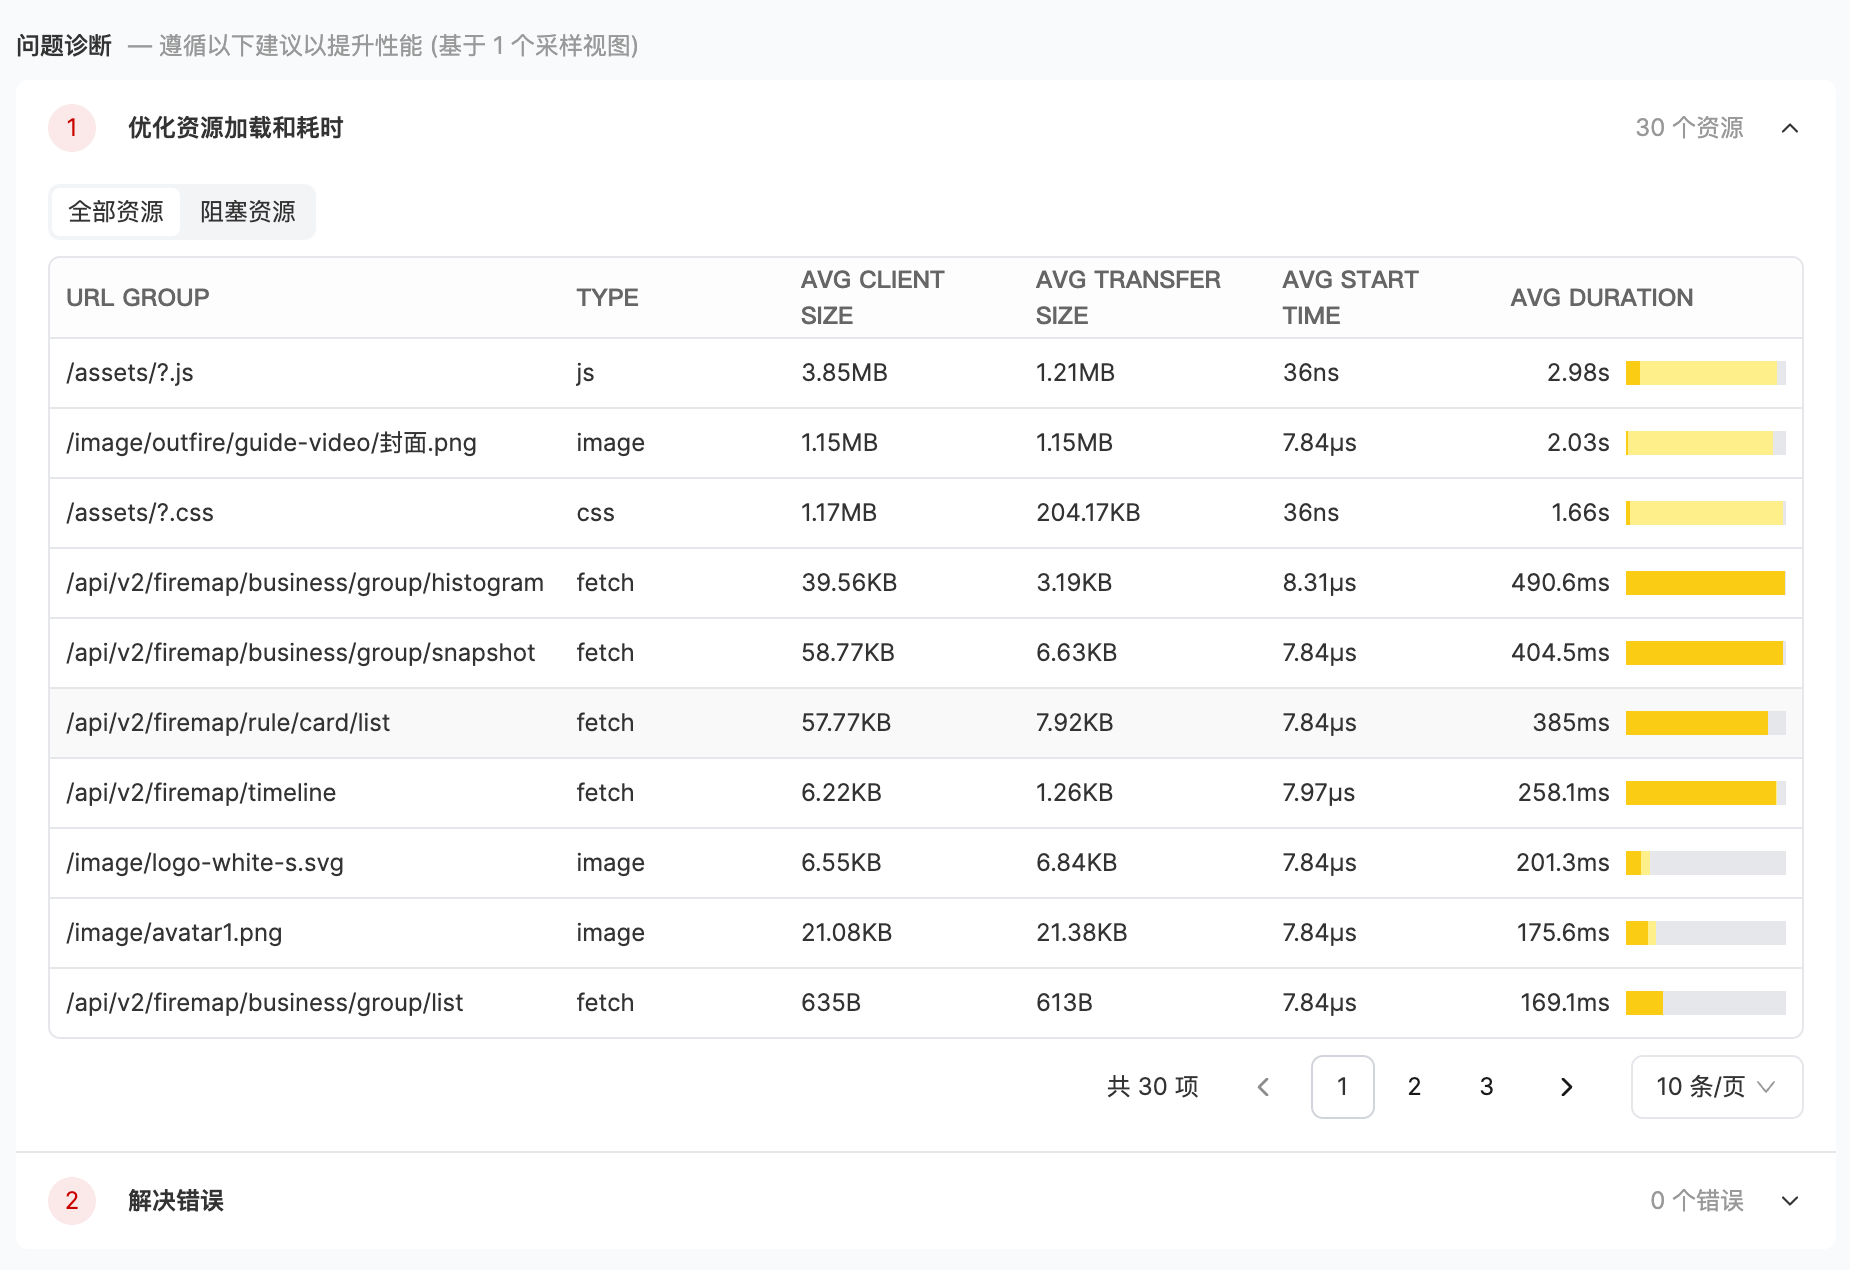
Problem Diagnosis
View Event Samples
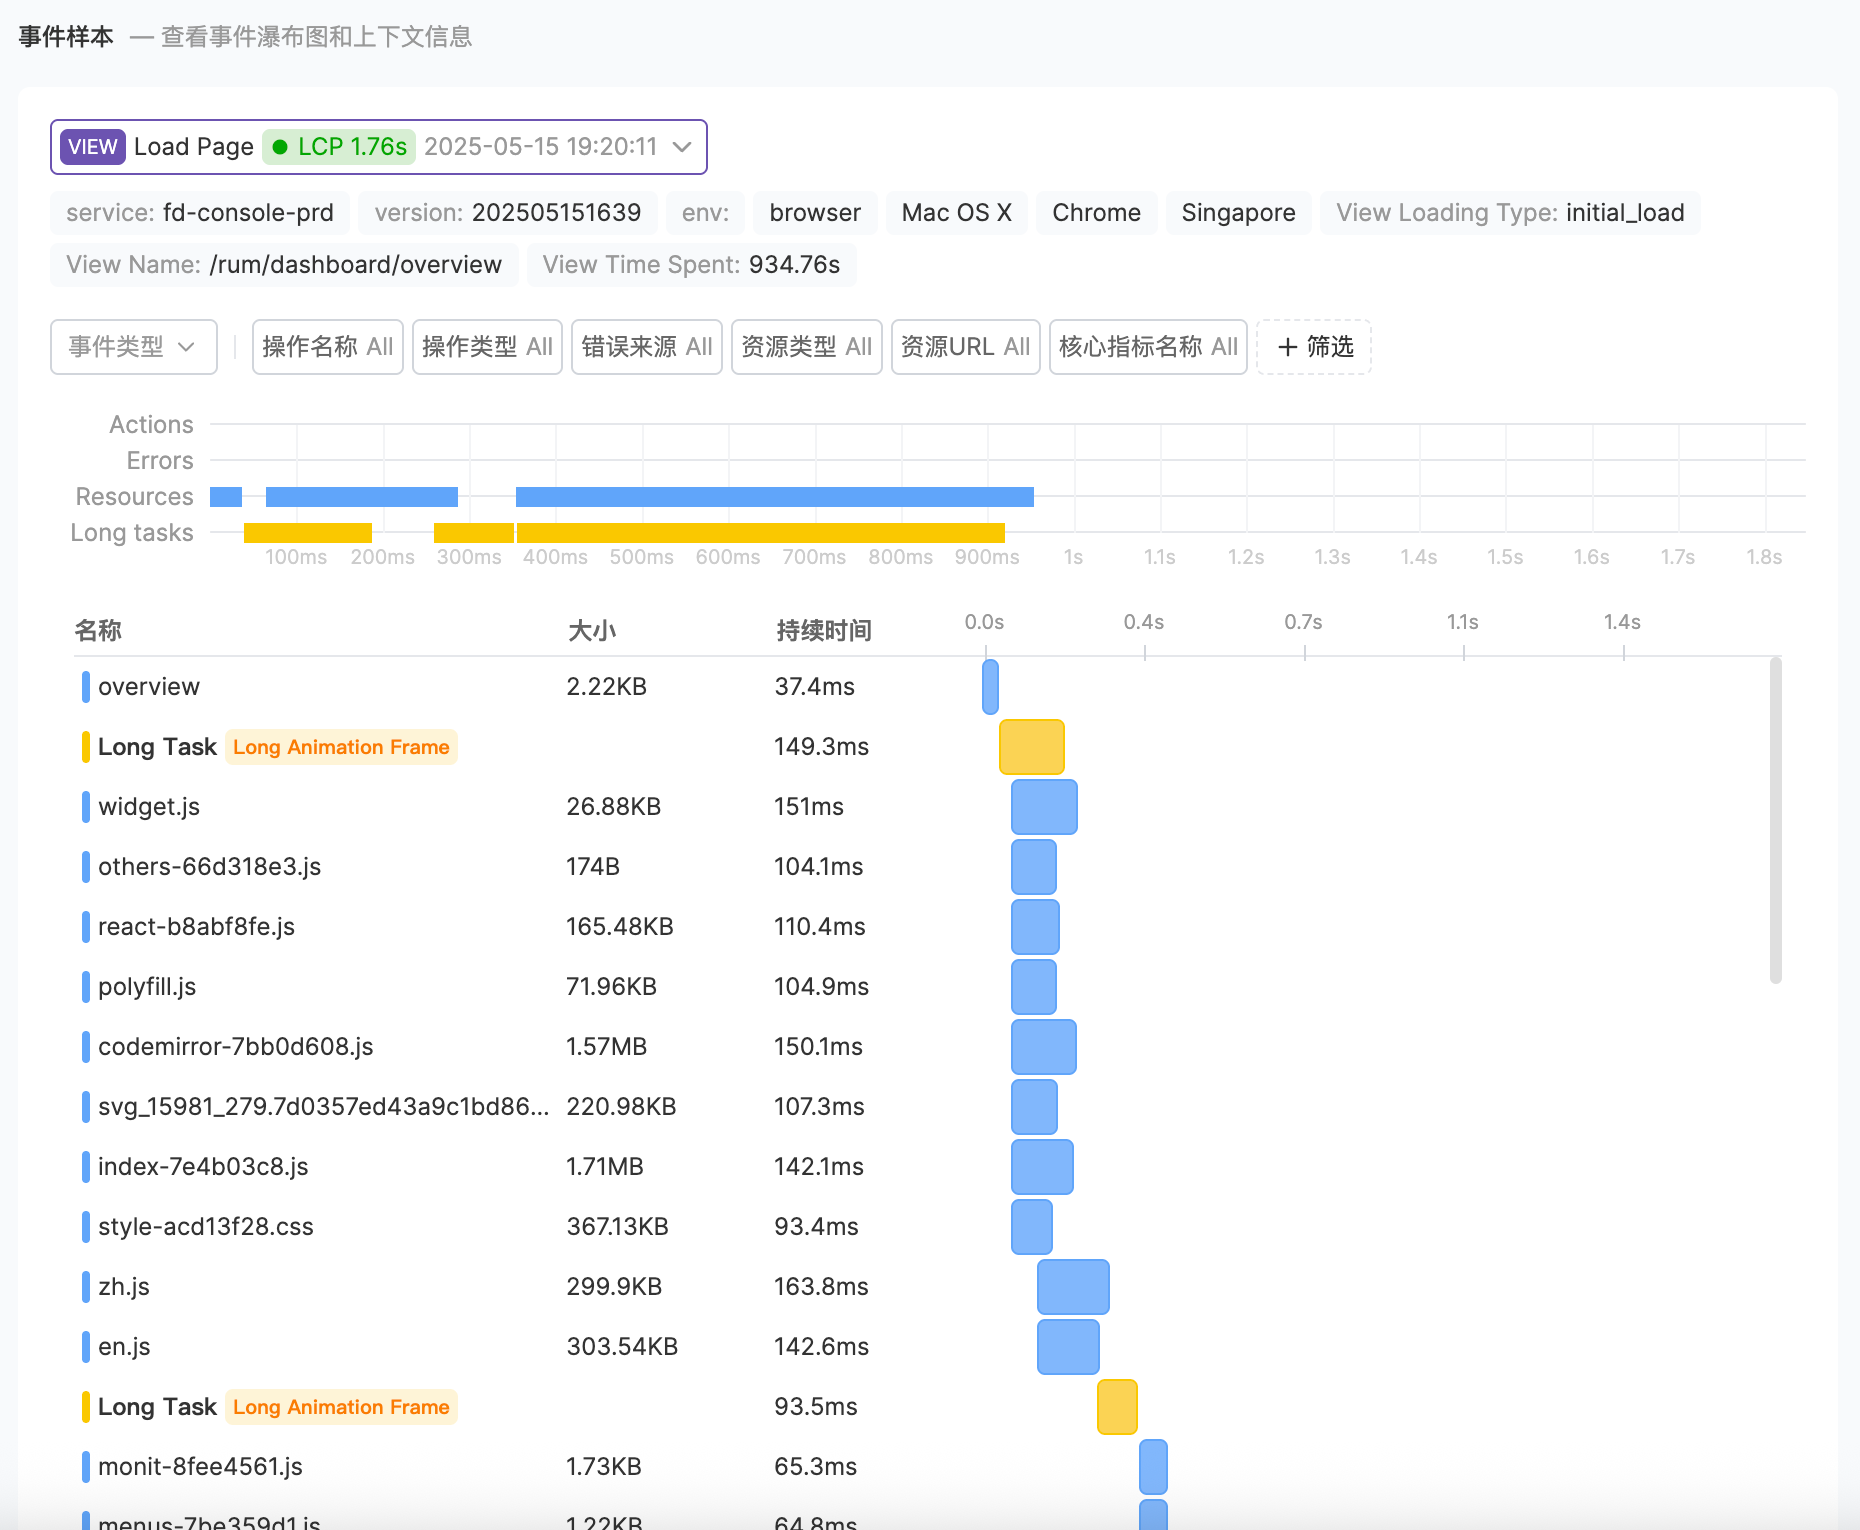
You can use the dropdown menu in the top left to select another sample event, and expand any event in the waterfall by clicking on it to view the side panel.
You can also select an appropriate set of events for problem analysis and diagnosis by filtering event types and various filter options.


 微信扫码交流
修改于 2025-05-20 08:50:34