Overview#
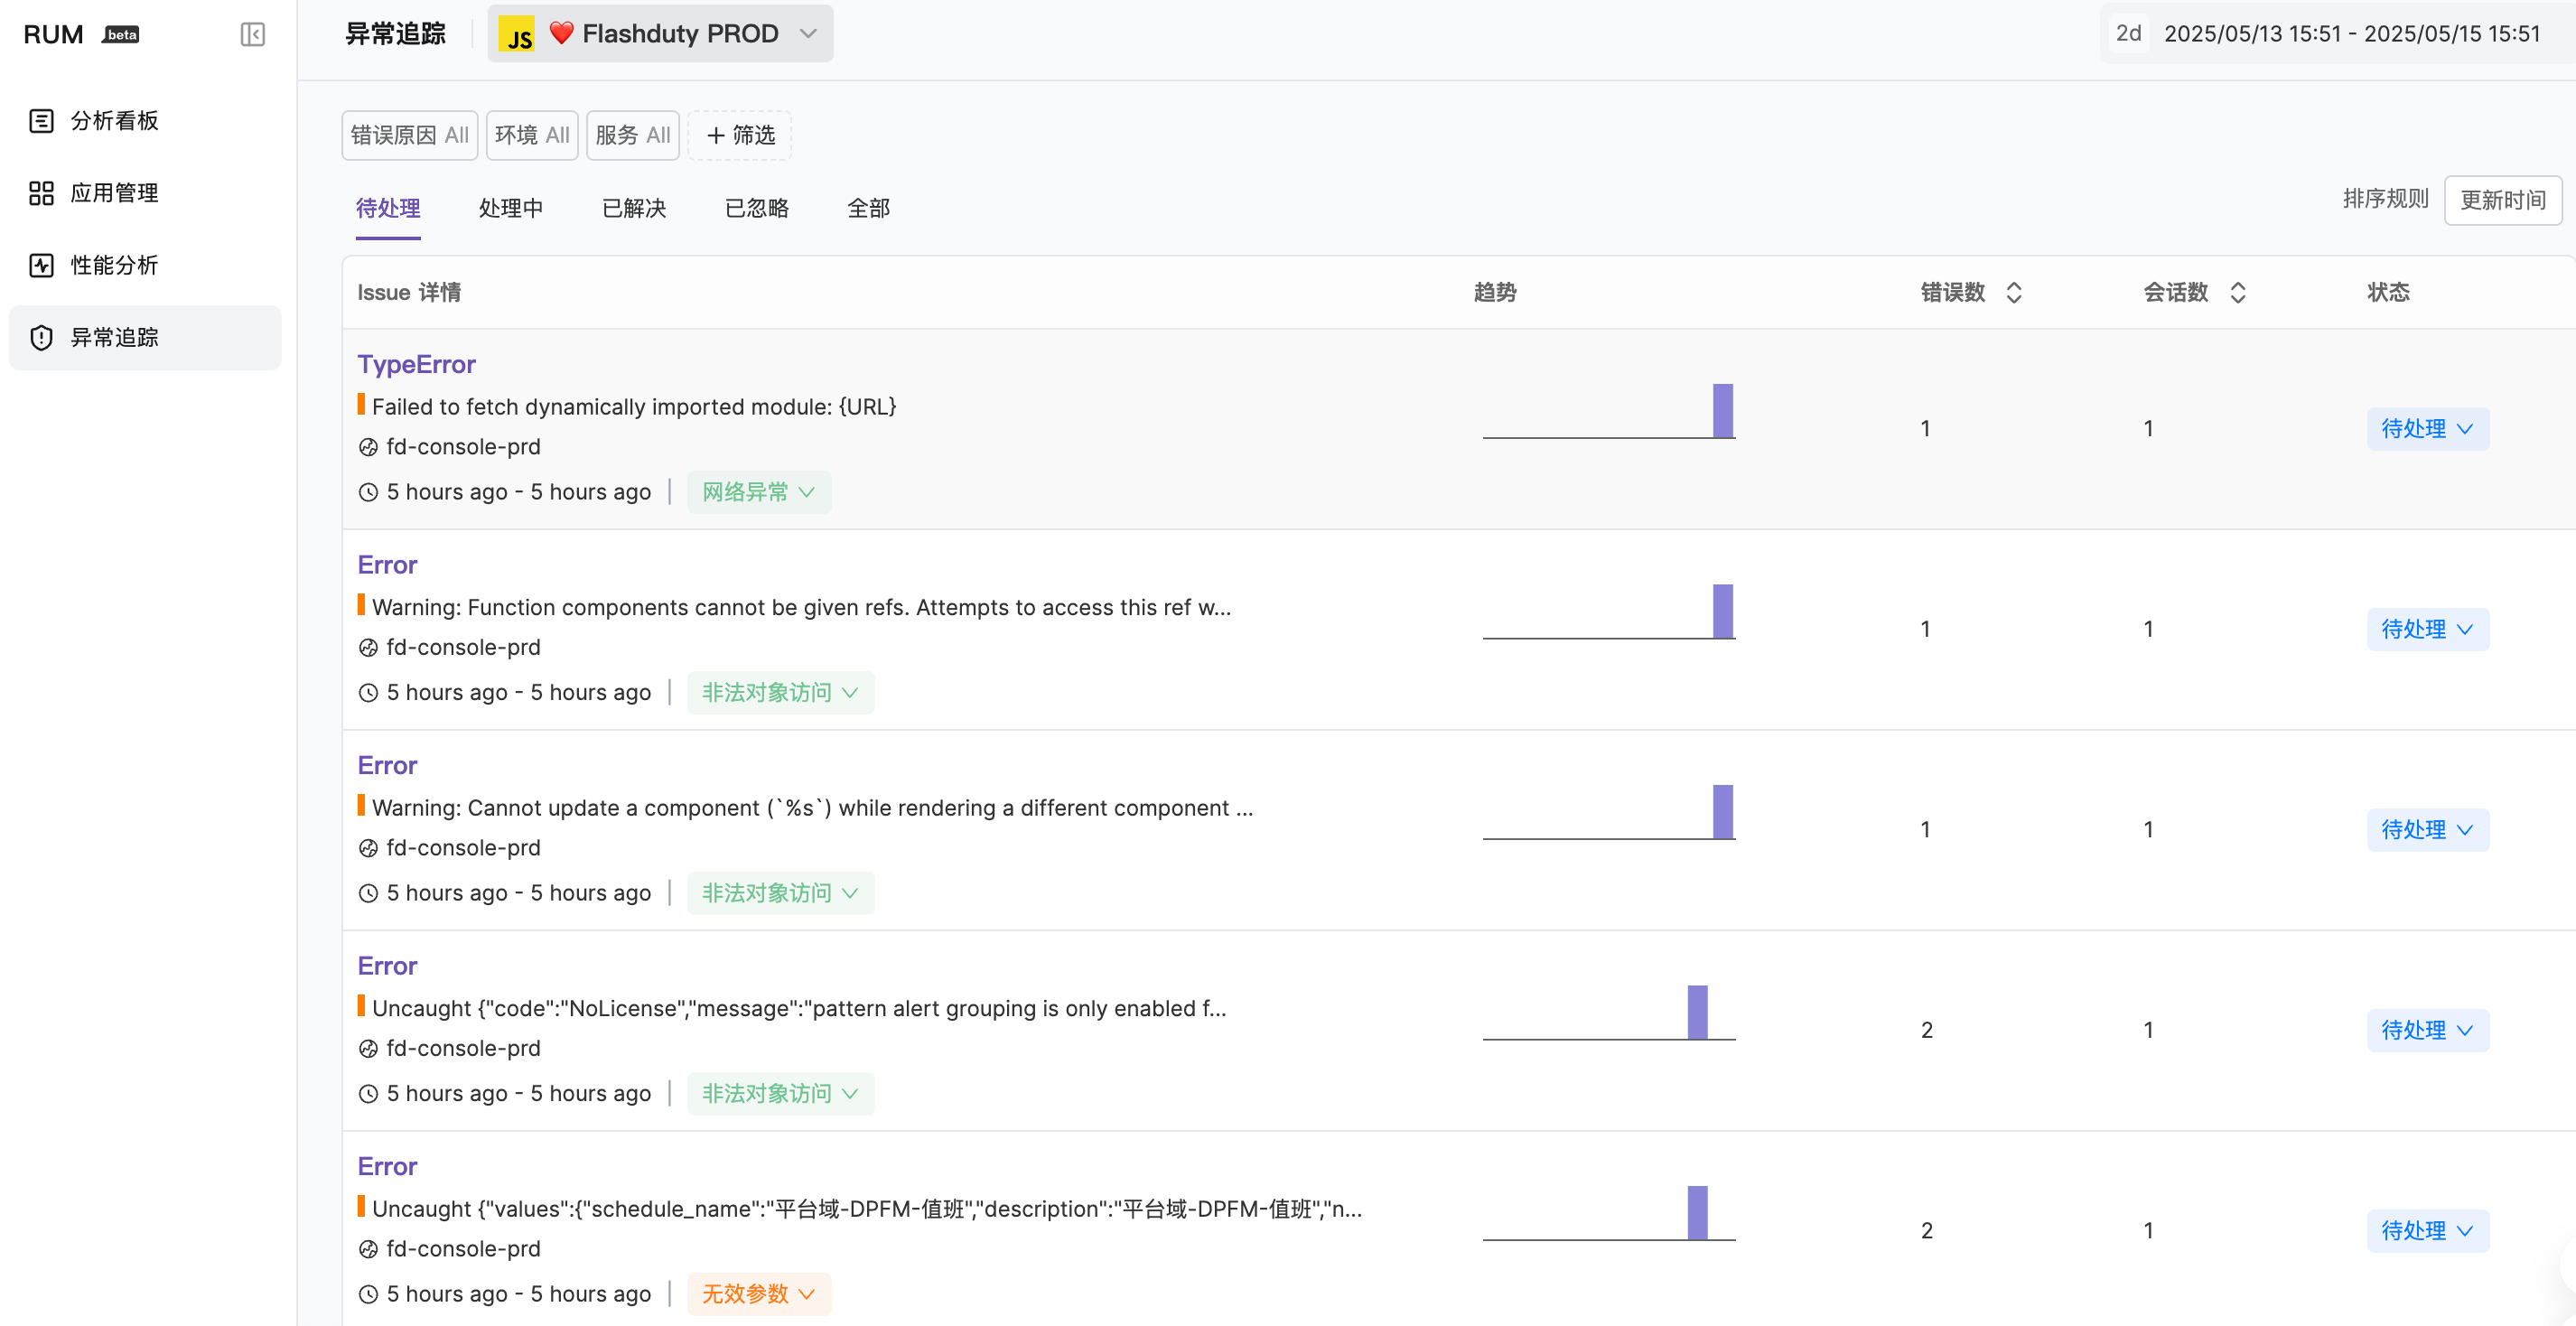
After errors are reported, you can view Issues in the error tracking module. In Flashduty RUM, an Issue is composed of a group of similar errors, typically related to the same bug. Detailed grouping rules can be found in Error Grouping. In the list, you can view and filter errors, and further locate problems by examining the context and stack information provided in the details.Each entry listed in the Issue browser contains the following information:Error type and error message
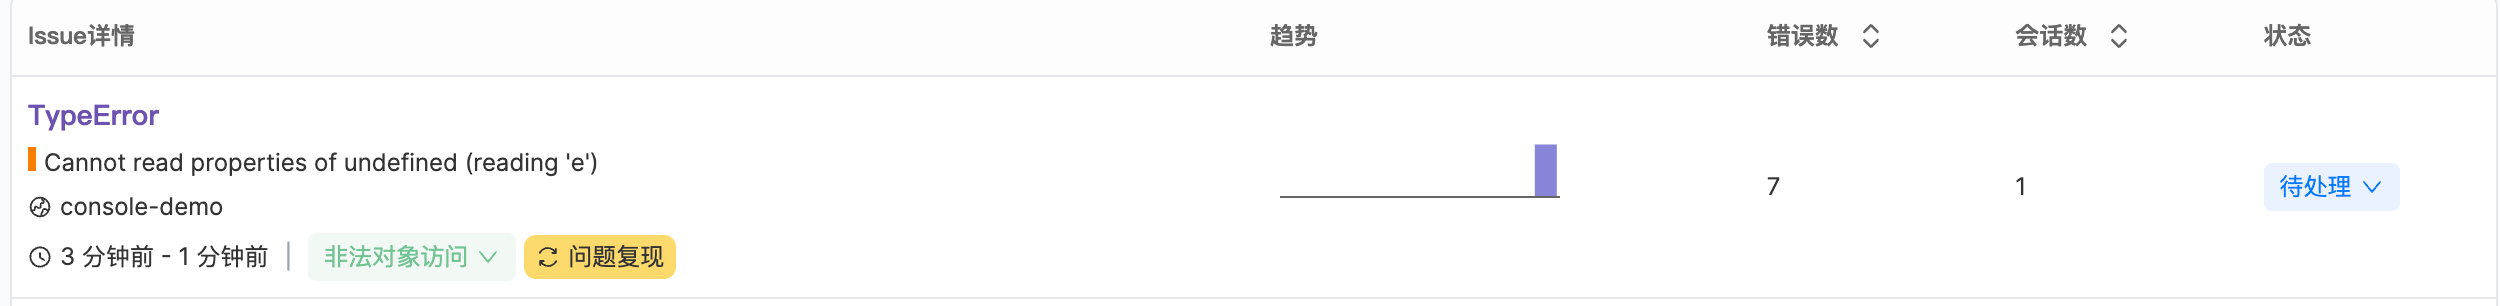
File path where the error occurred
Whether the issue has recurred
Important information about the Issue lifecycle:First and last occurrence times
Occurrence frequency chart over time
Number of occurrences within the selected time period
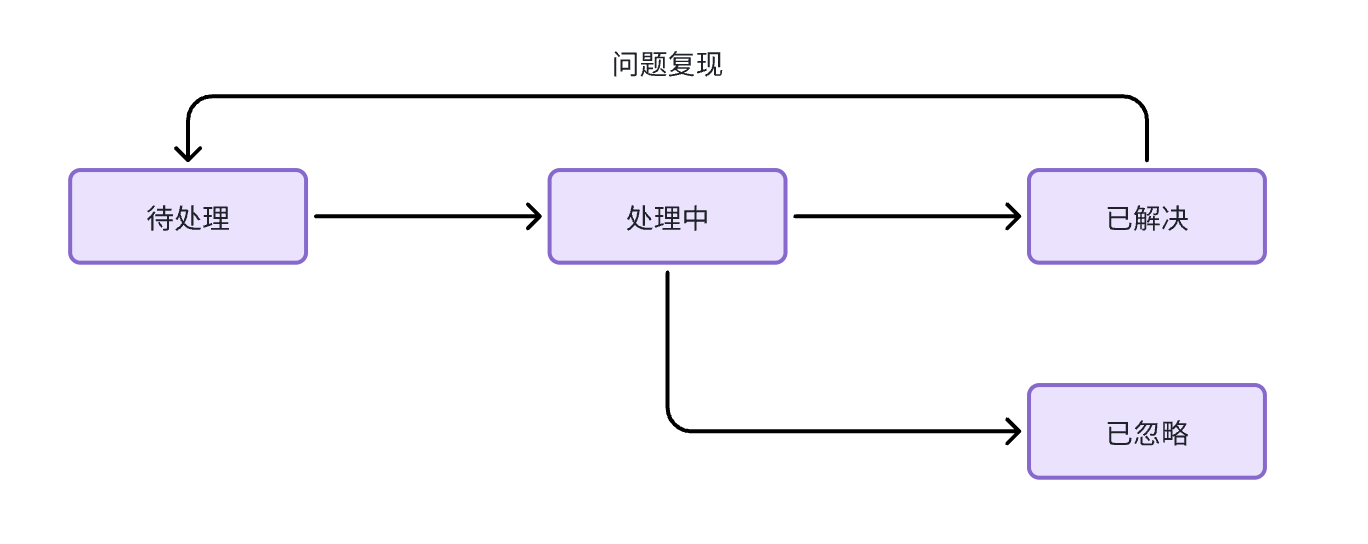
Issue Status#
Issues have 4 statuses: "Pending", "In Progress", "Resolved", and "Ignored". Their transition flow is as follows, where issue recurrence-related transition logic can be found at Issue States
Time Range#
The browser displays a timeline in the upper right corner, allowing you to display Issues with errors that occurred within a selected time period. You can change the time range by selecting a preset range from the dropdown menu. You can also modify the time directly or use natural language for filtering.Sorting Method#
You can sort the Issue list using the following options:Update Time: Sort by issue update time (default sorting).
Creation Time: Sort by when the issue was first discovered.
Occurrence Count: Sort by the total number of error occurrences within the selected time range.
Affected Session Count: Sort by the number of affected RUM sessions.
Filters#
Flashduty RUM automatically establishes predefined attribute indexes for your Issues and creates corresponding filters. Each filter displays all different values for that attribute within the selected time period and provides basic analysis, such as error causes, environments, etc. Filters allow you to categorize or filter Issues based on specific attributes.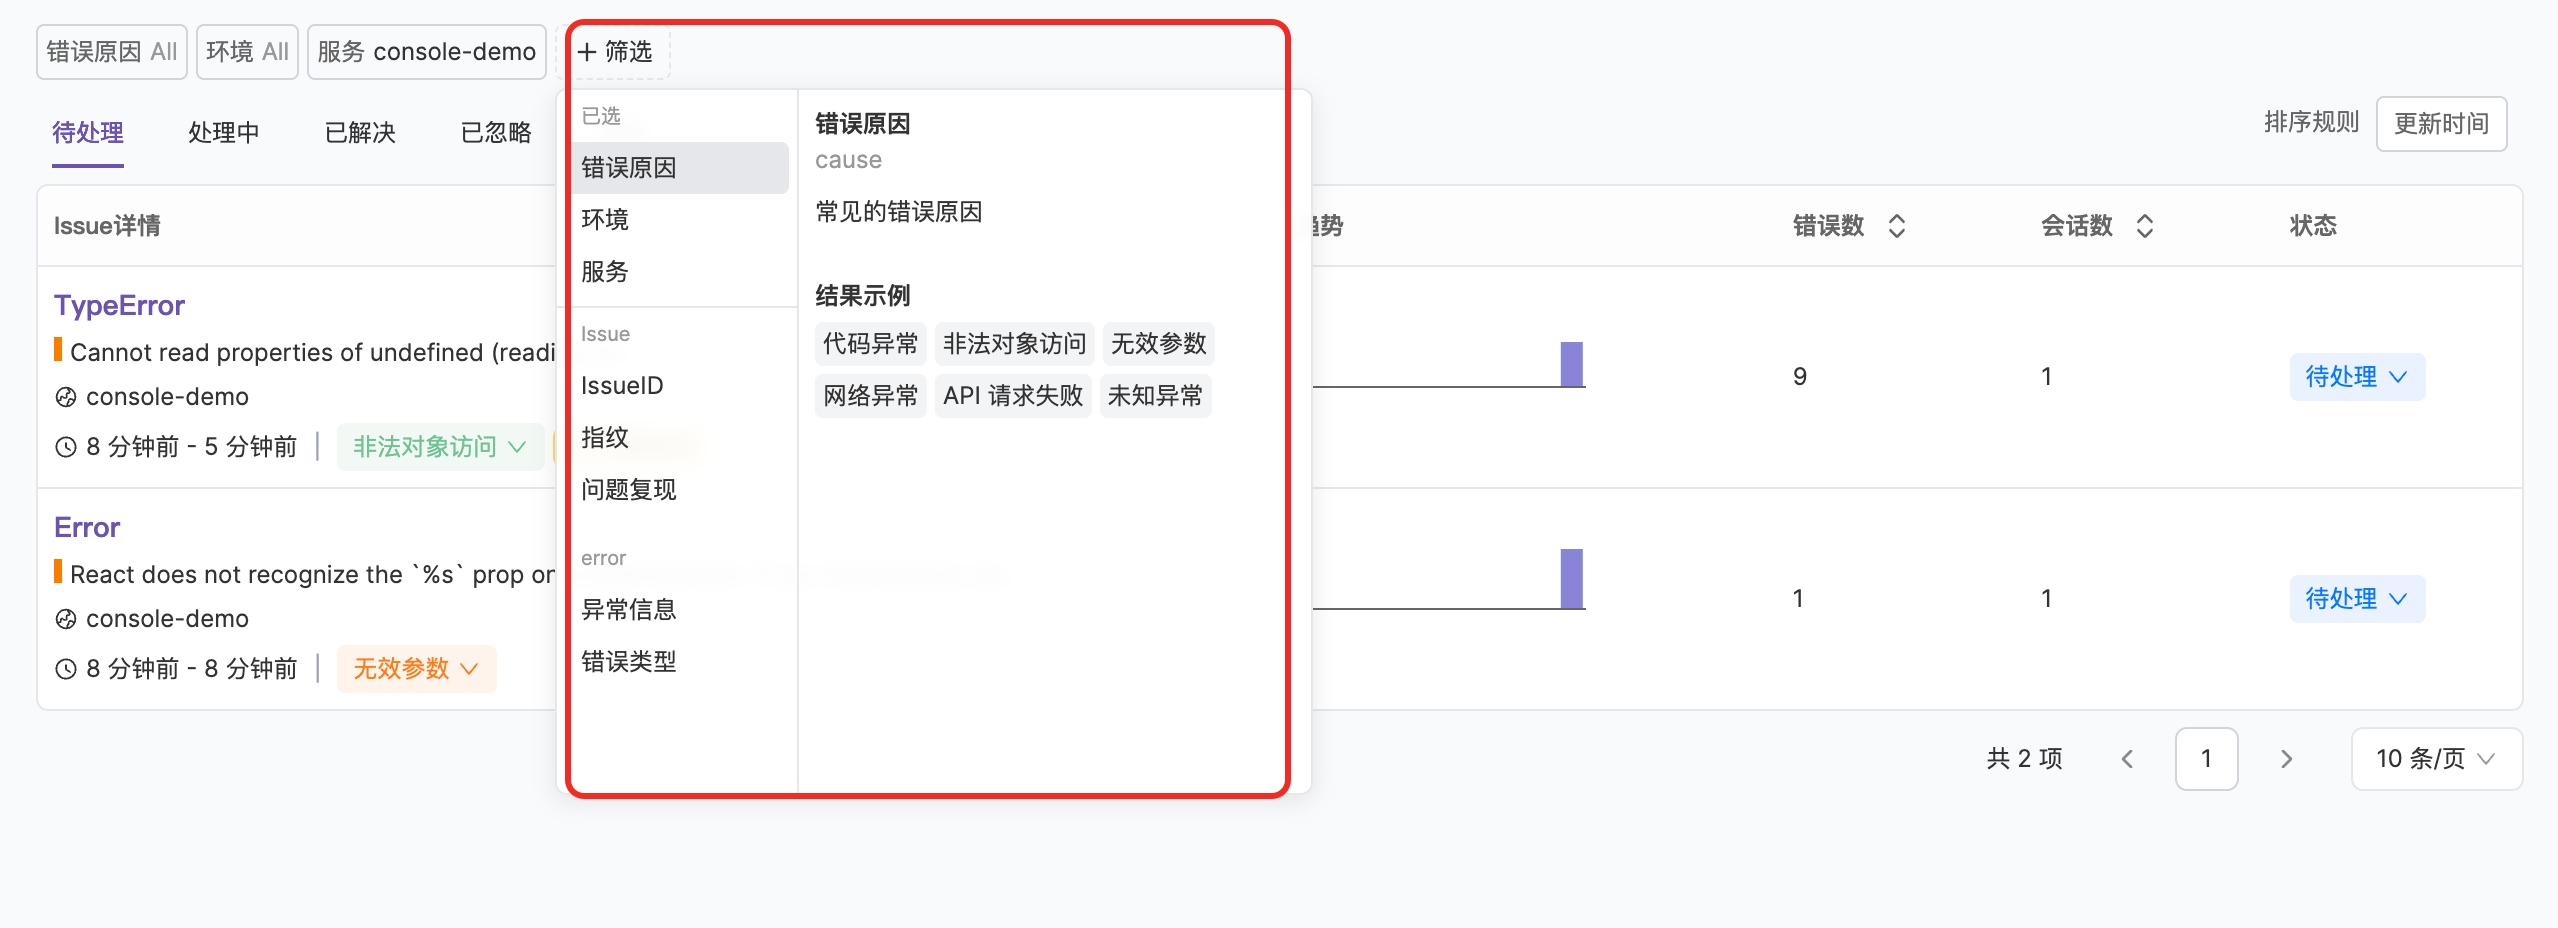
Currently supported attributes include:| Attribute | Description |
|---|
| Error Cause | Possible root cause type when the error occurred |
| Environment | The env field when the Issue was reported |
| Service | The service field when the Issue was reported |
| Error Type | The error.type field in the reported error event |
| Error Message | The error.message field in the error event, supports fuzzy matching |
| IssueID | ID assigned during Issue grouping, multiple IDs can be separated by commas |
| Issue Recurrence | If a resolved issue occurs again, the Issue will be marked as recurred |
| Fingerprint | Fingerprint information during Issue grouping, multiple fingerprints can be separated by commas |
Click the "+Filter" button to view all filters and add, modify, or delete conditions.Error Causes#
Flashcat adds a classification of possible error causes each time an issue is created. This initially added error type helps improve the efficiency of fault localization and facilitates Issue filtering and priority sorting. You can modify the error classification reason as needed during subsequent browsing. When you hover over the error cause classification, the system will further provide inferred root causes and repair suggestions for reference by combining AI capabilities.Error causes are classified as follows:Code Error: Errors caused by code defects.
Illegal Object Access: Code accessing null or undefined objects.
Invalid Parameter: Calling functions with invalid parameters.
Network Error: Server response time too long or slow network speed.
API Request Failure: API endpoint returned an error status code.
Unknown Error: The error type cannot be located.
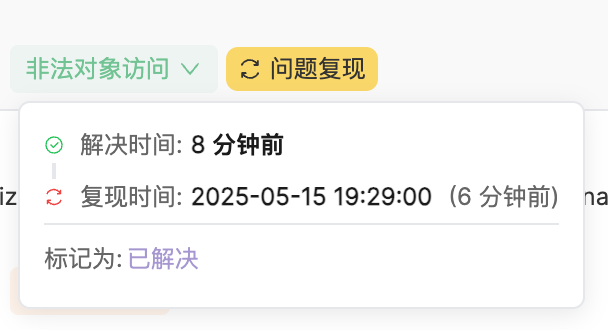
Issue Recurrence#
Issue Recurrence (Regression) refers to a previously fixed bug occurring again. In FlashDuty, if an error has been marked as resolved but the same error occurs again later (with a different version), the Issue status will reopen from the end state and be marked as "Issue Recurred". You can view information about recurred Issues in the list.Issue Details#
Click on any Issue to open the details panel for more information.
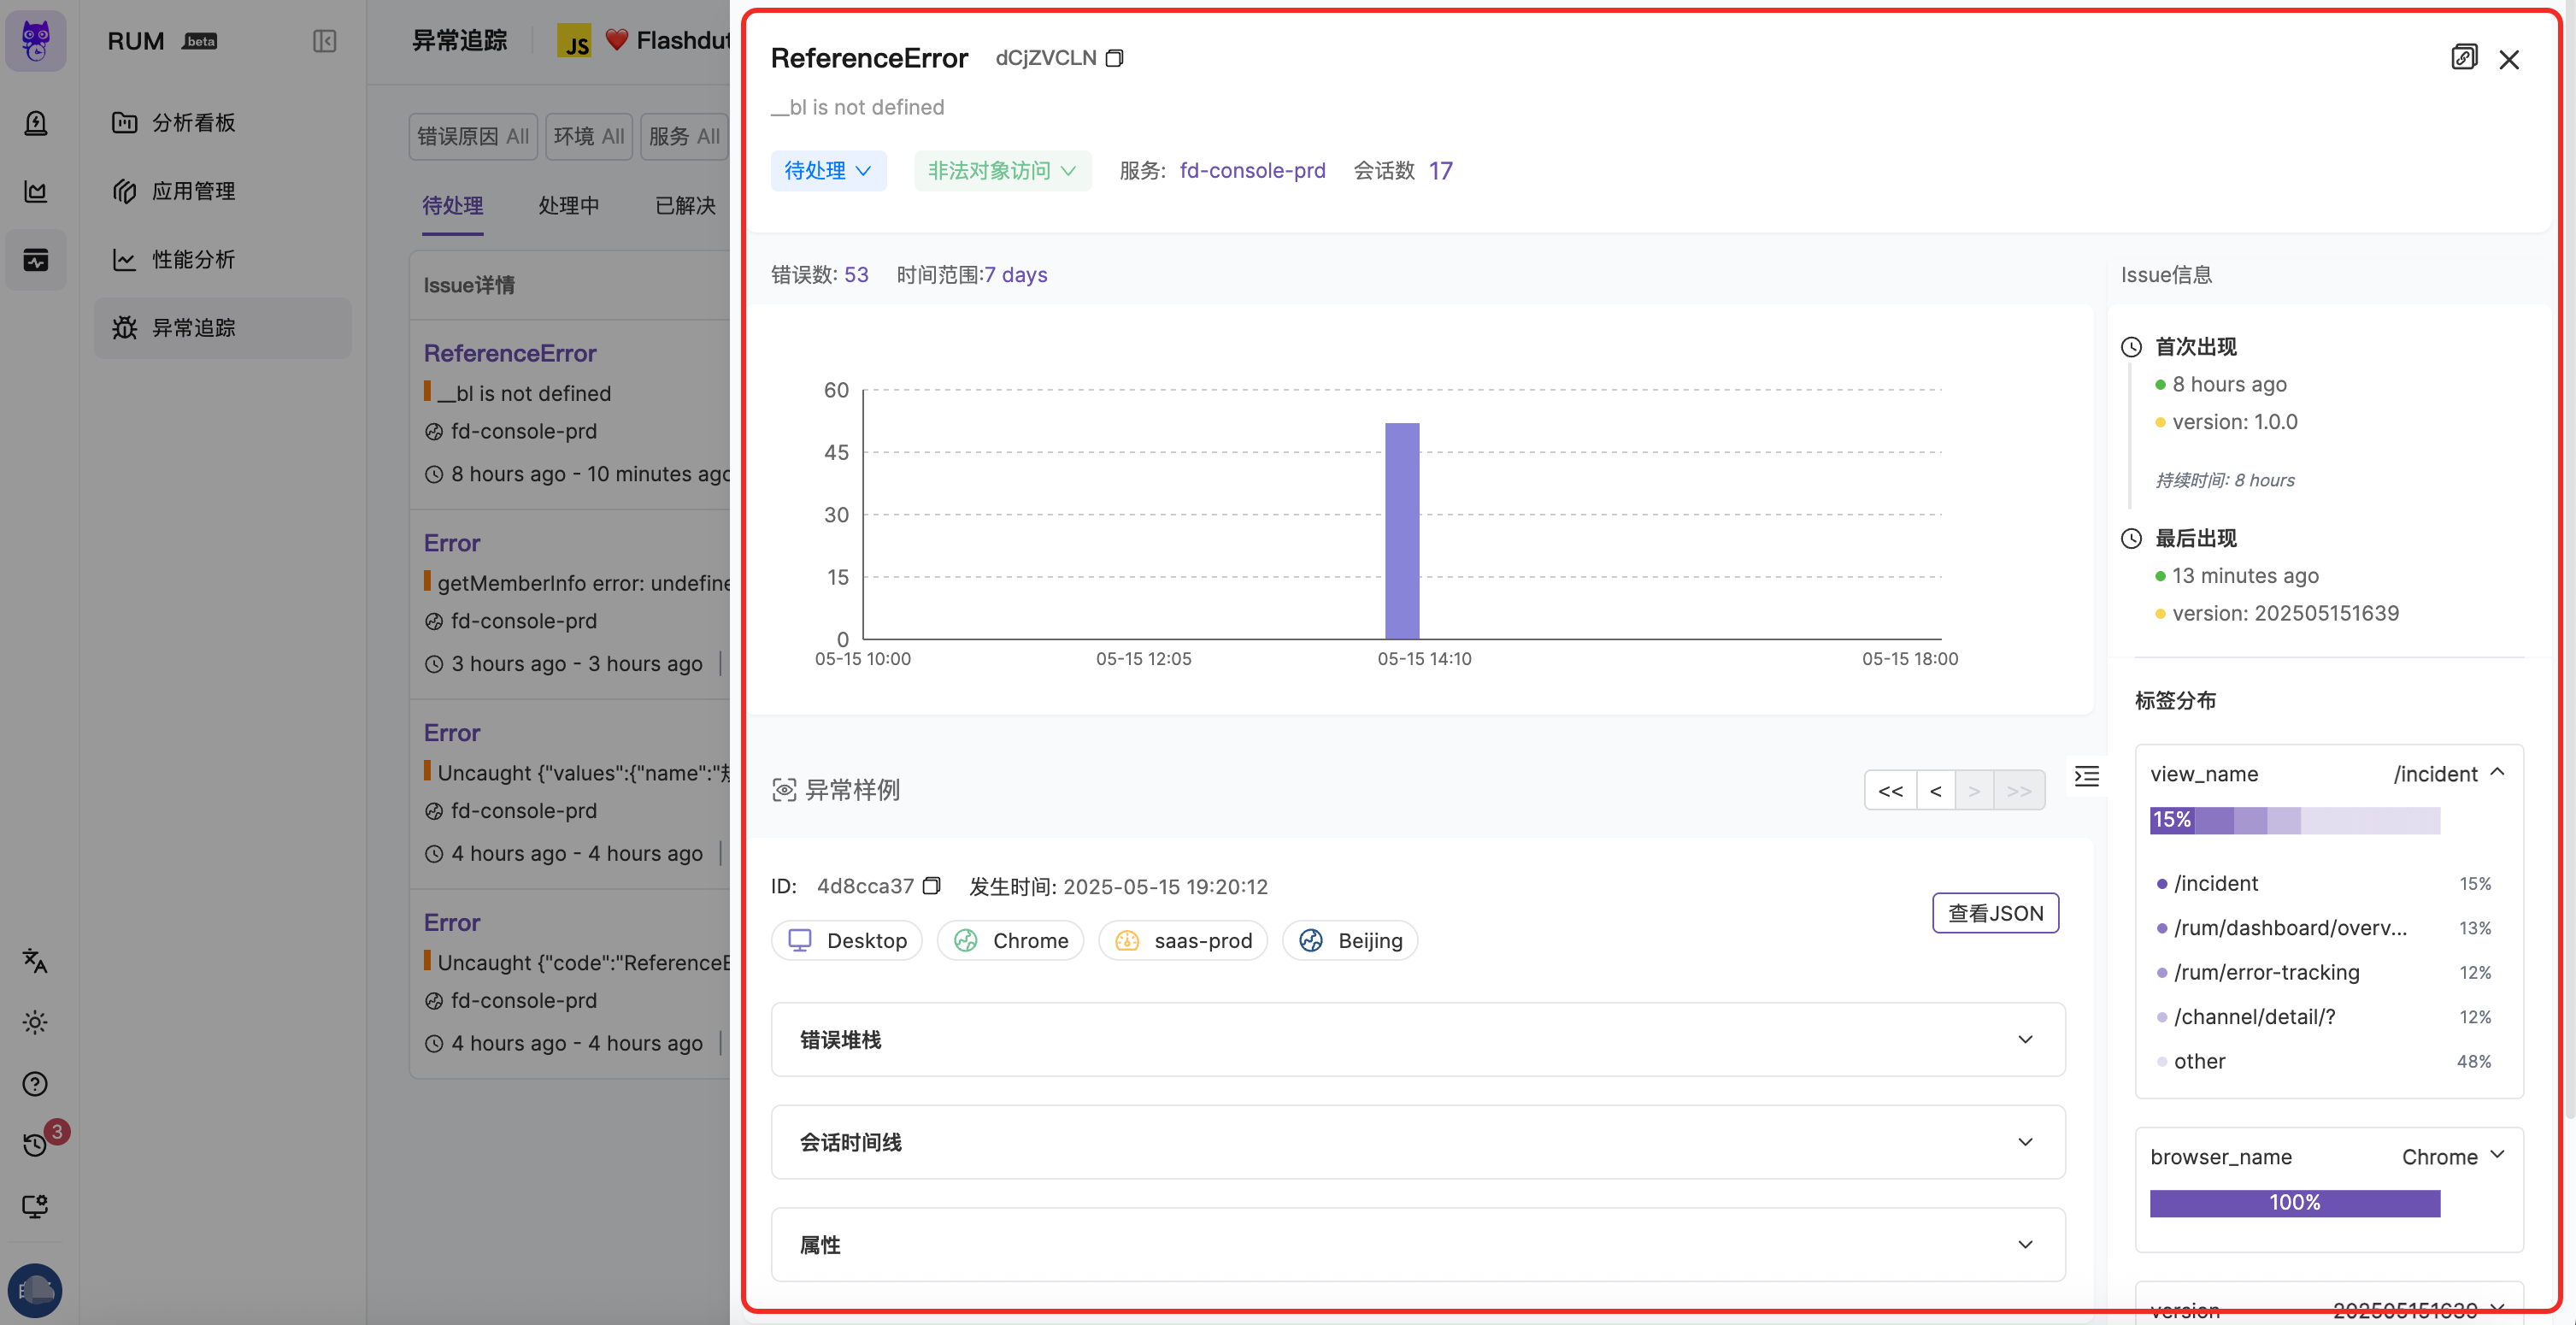 The upper part of the panel displays basic information about the Issue, such as status, error cause, etc. You can also learn about the Issue's lifecycle: when the Issue first and last appeared, its duration, and the number of error occurrences over time (aggregated at a certain time granularity).
Tag Distribution#
In the tag distribution section, you can view the proportion of different tags under this Issue across various dimensions, helping you quickly determine the scope of impact and assist in locating the root cause. Currently supported tags include view_name, browser_name, version, env, etc.Error Samples#
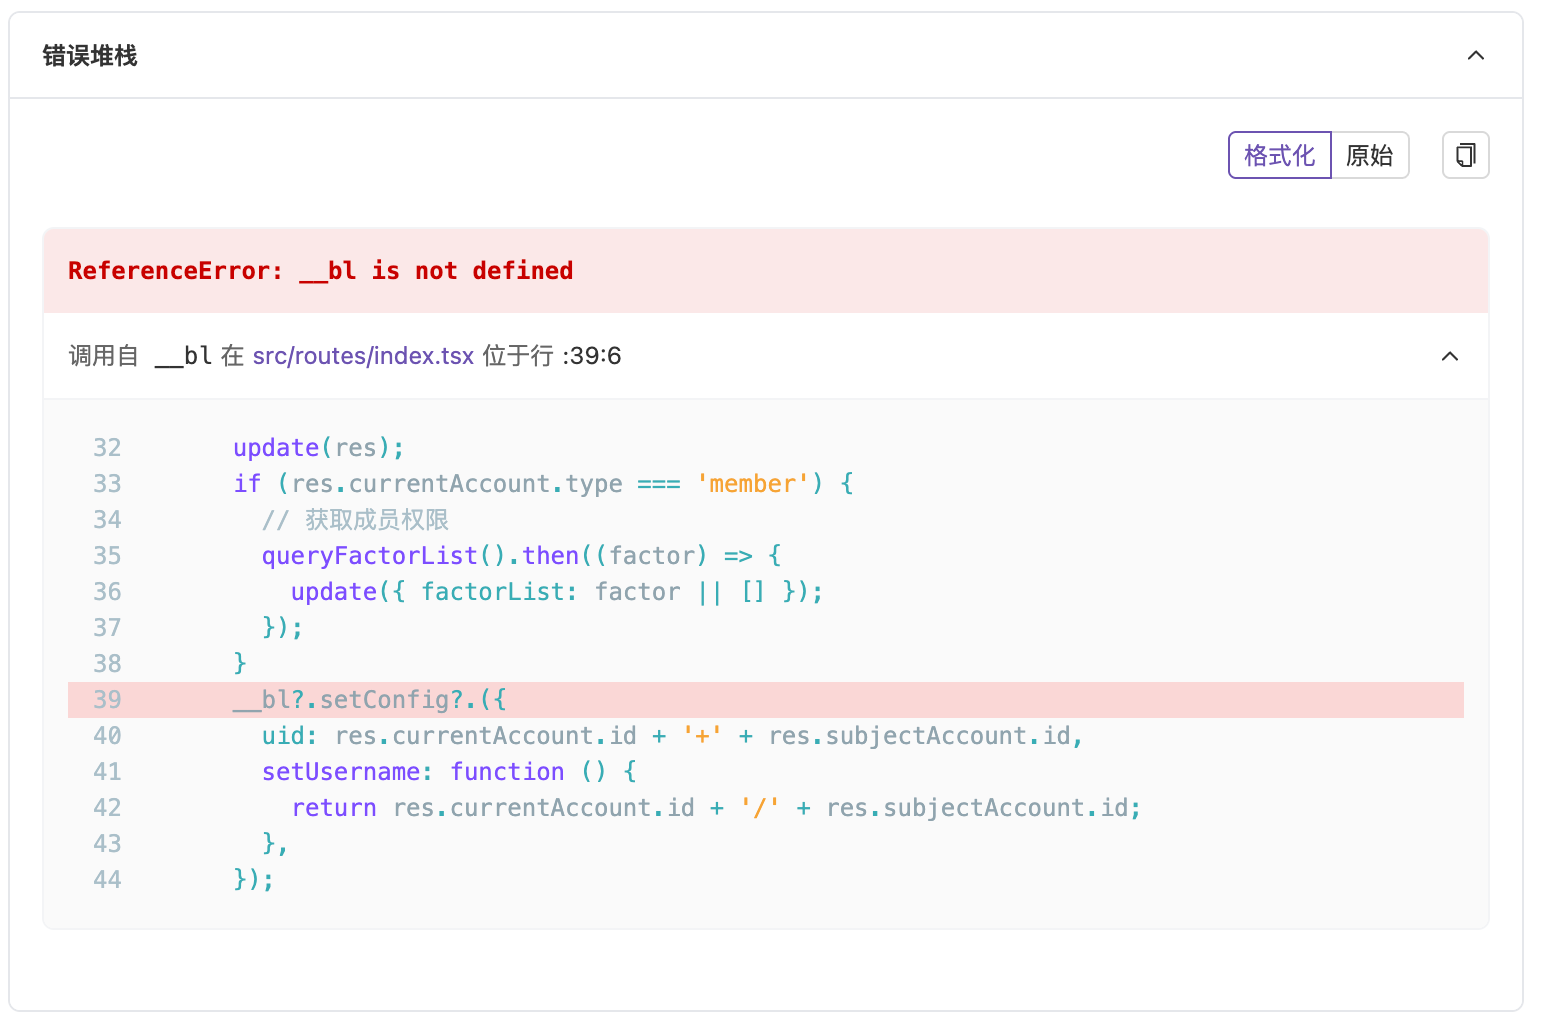
By default, the most recent error information reported during the current Issue occurrence is displayed as an error sample. You can also switch using the navigation bar.Error Stack#
You can view the error's context information and stack information. If you have uploaded source code, you can see the stack information when the exception occurred. You can view your uploaded source code information in "Application Management" - "Source Code Management". See Source Mapping for detailed instructions.
Session Timeline#
You can see the total number of Session events for the current error example and view the user's resource access and operation information before and after the exception occurred.Currently, a maximum of 20 contextual information items, including the current Error event, are displayed to help define the exception. Later, you can view more log information in the Session Viewer module.
Properties#
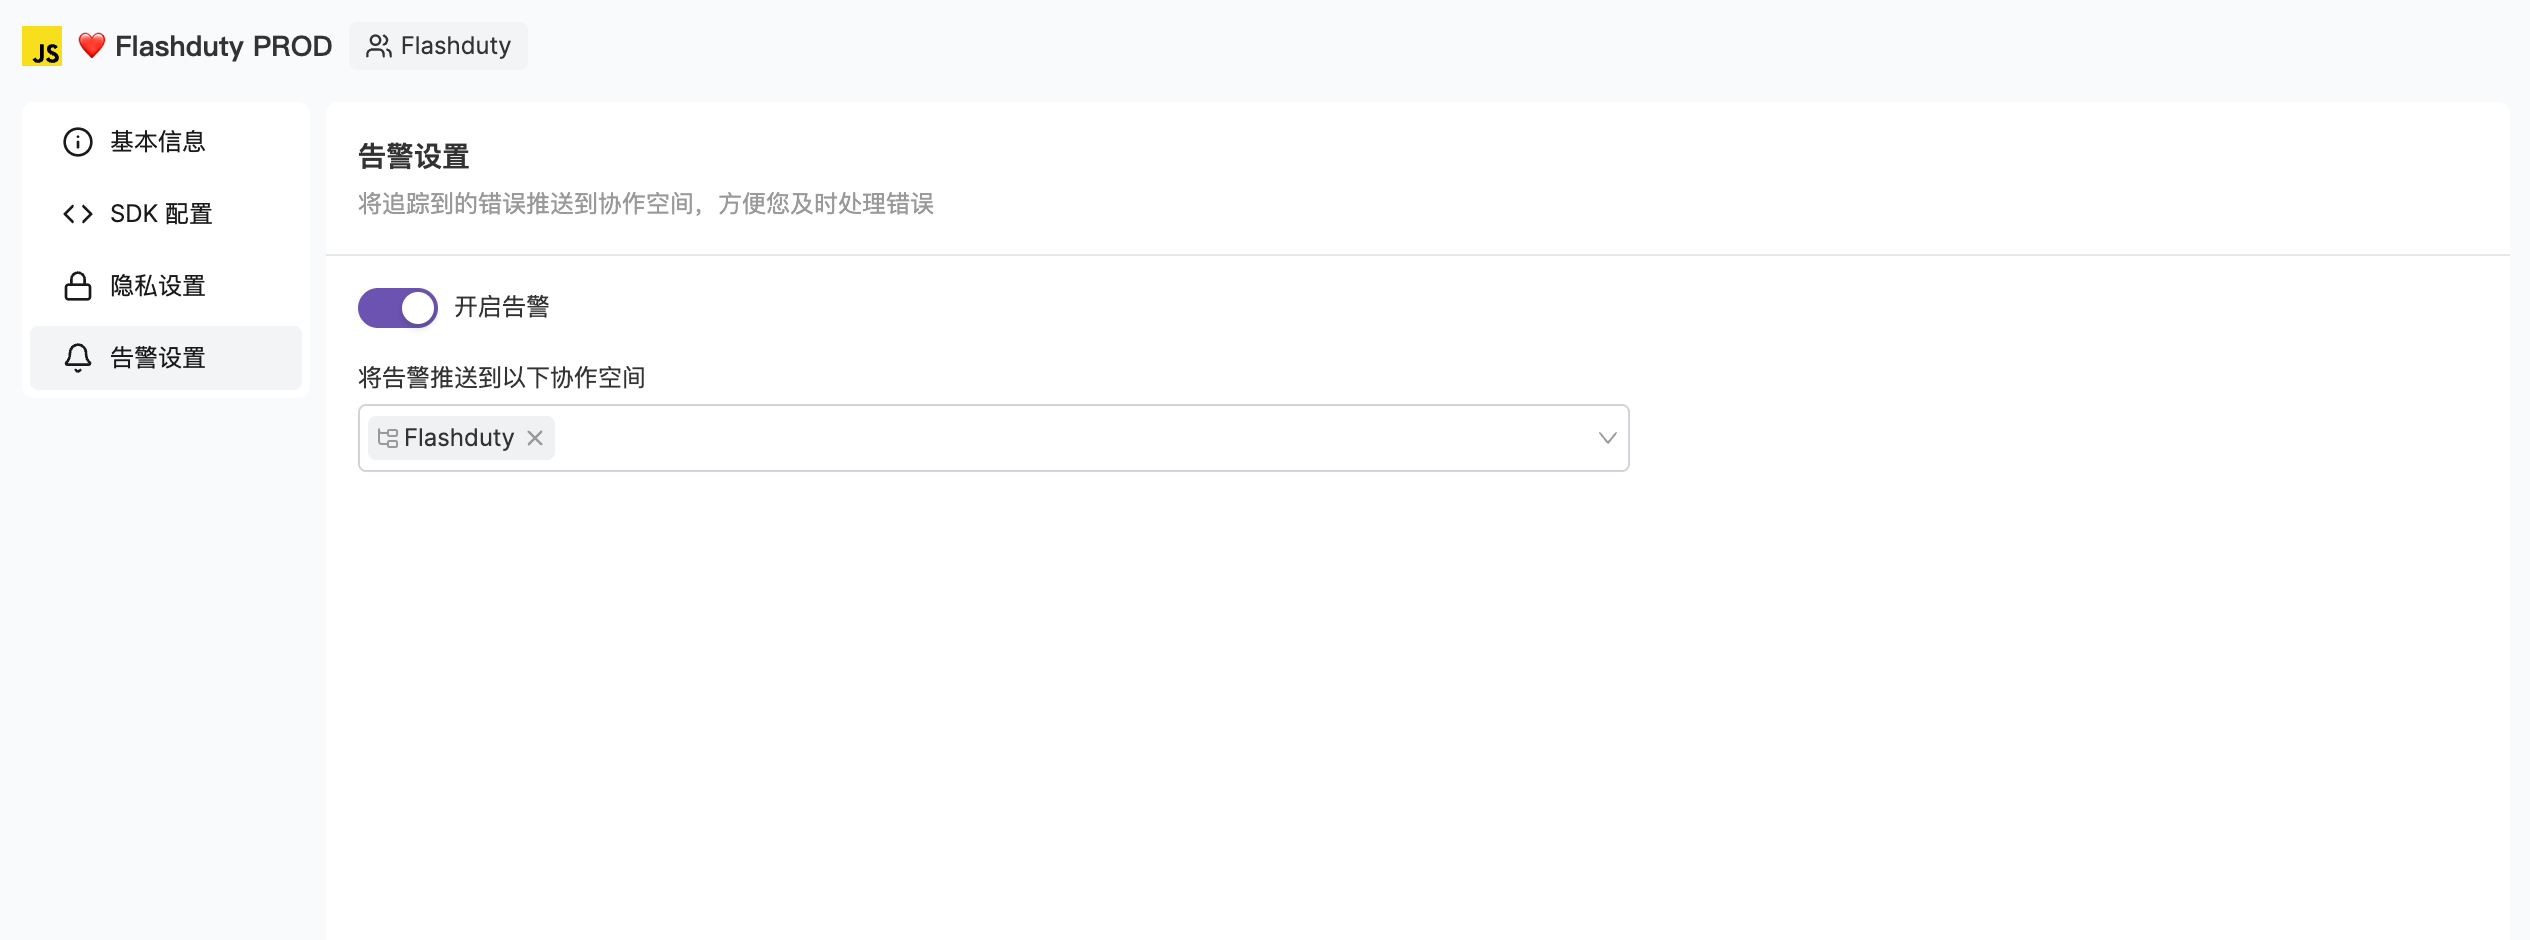
When exception events are reported, they carry a series of properties. You can view various information such as the current Session, view, user, etc. in the properties section to help troubleshoot problems.Exception Alerts#
Discovering problems as soon as they occur gives you the opportunity to proactively identify and fix them before they become serious. Exception tracking monitoring allows you to track any new issues or issues that have a significant impact on your system or users. You can edit by selecting the application card in "Application Management", enable "Alerts", and select the collaboration space for notifications. See Issue Alerting for specific instructions.
Best Practices#
1.
Configure Source Mapping: Facilitates problem localization in the production environment
2.
Add User Information: Configure user-related information to provide better error context
3.
Set Alert Strategies: Configure reasonable collaboration spaces and dispatch strategies for errors
4.
Regular Error Analysis: Regularly check error reports to discover potential problems
5.
Team Collaboration: Use team ownership features to ensure issues can be quickly assigned to relevant teams
6.
Monitor Regressions: Closely monitor potential regressions of resolved issues
Next Steps#


 微信扫码交流