
Performance Analysis
Performance Data Analysis
Accessing Performance Analysis
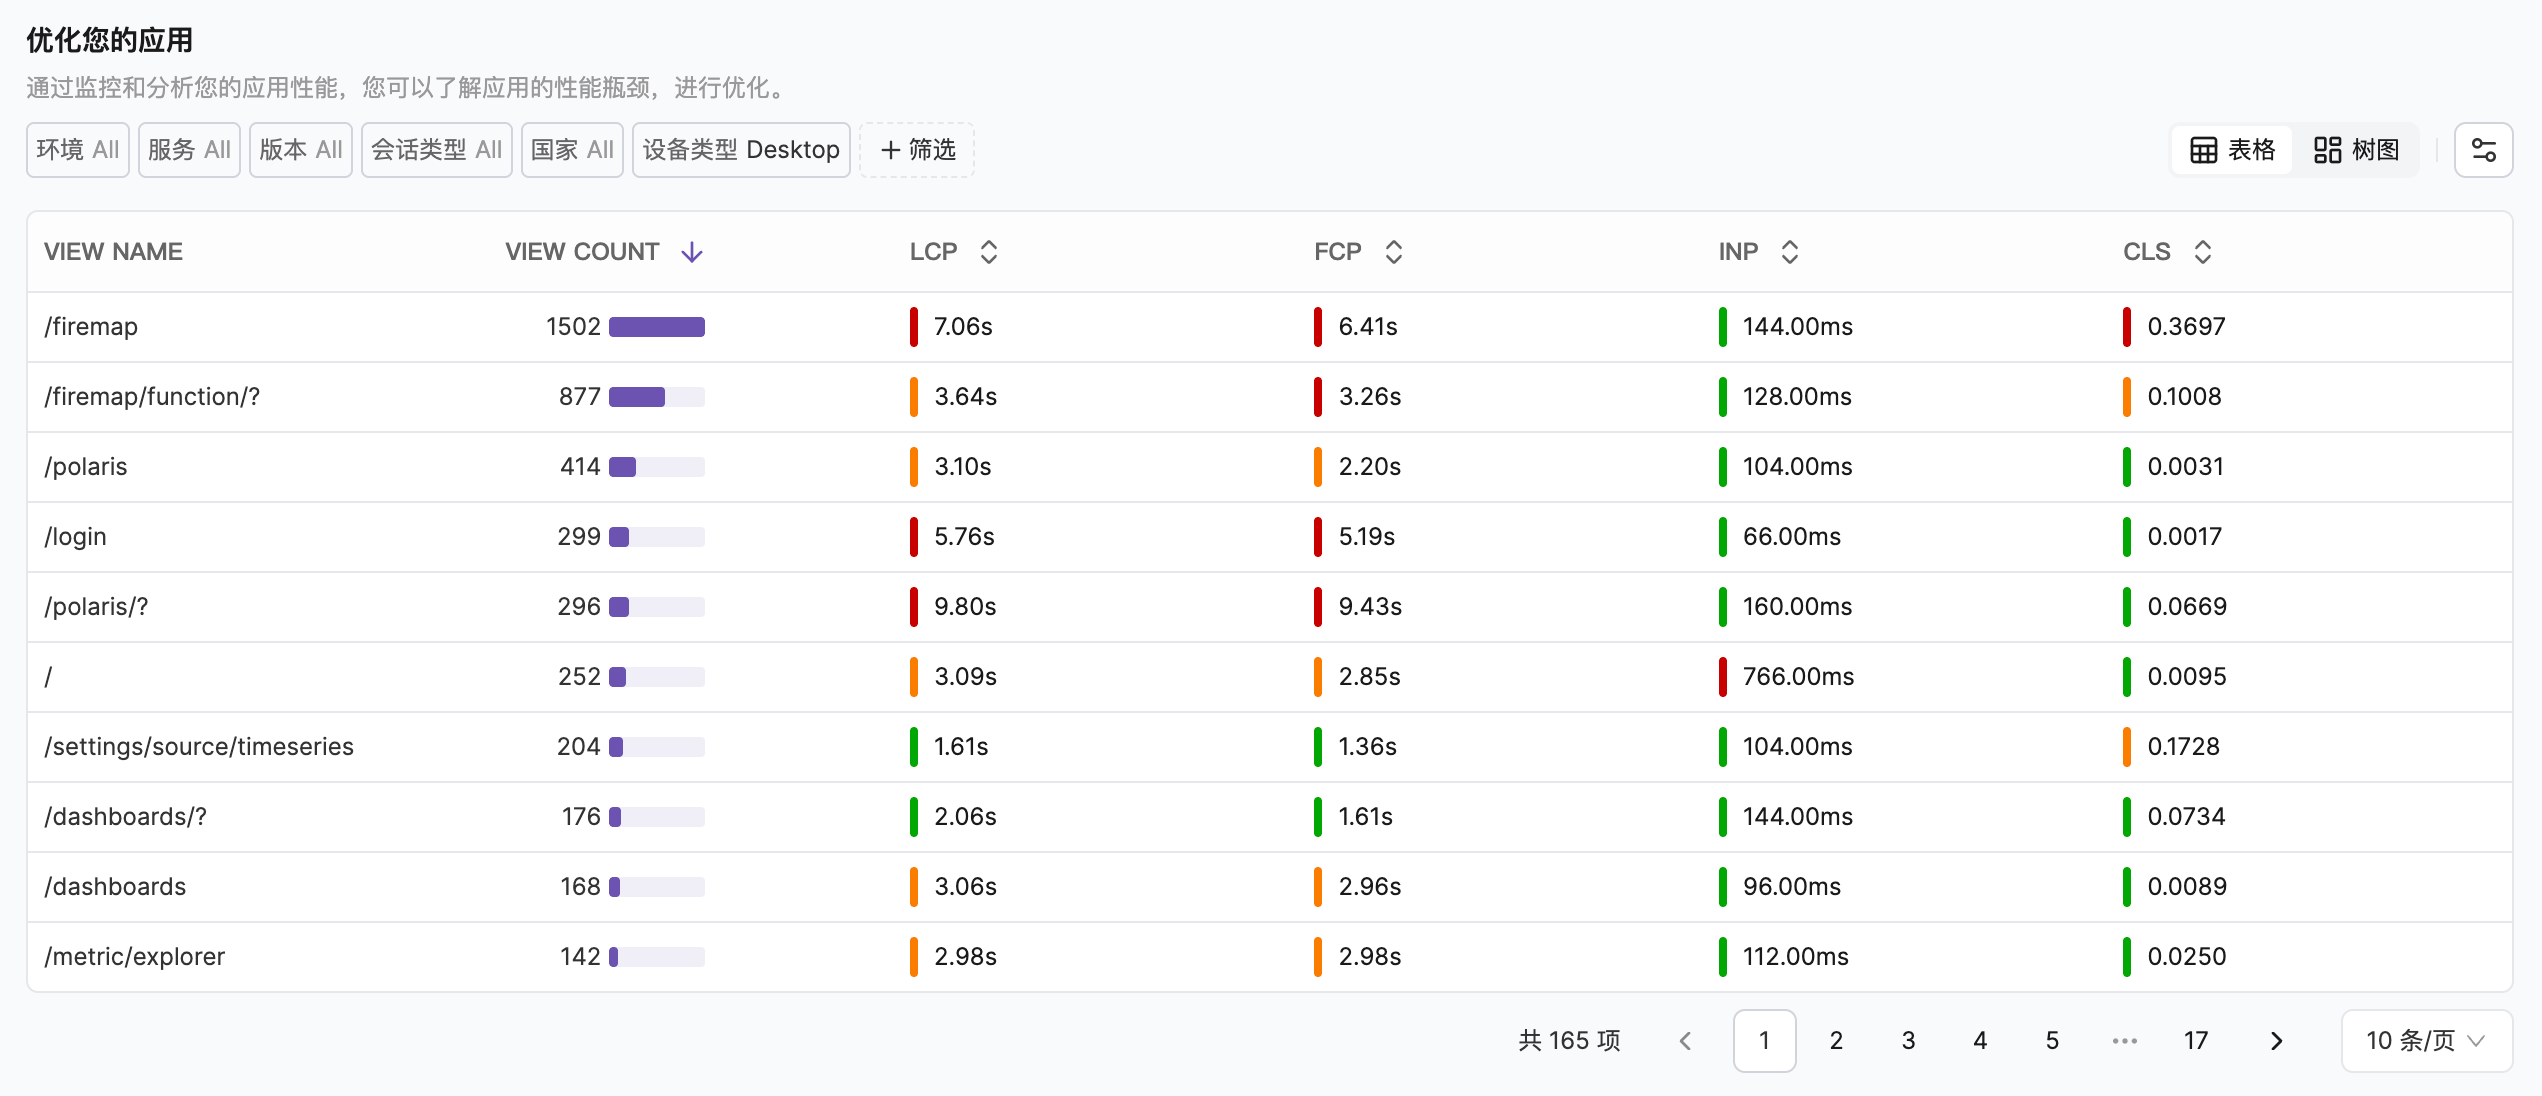
Good, Poor, and Average, with their distribution and proportion, allowing you to quickly locate problematic resources.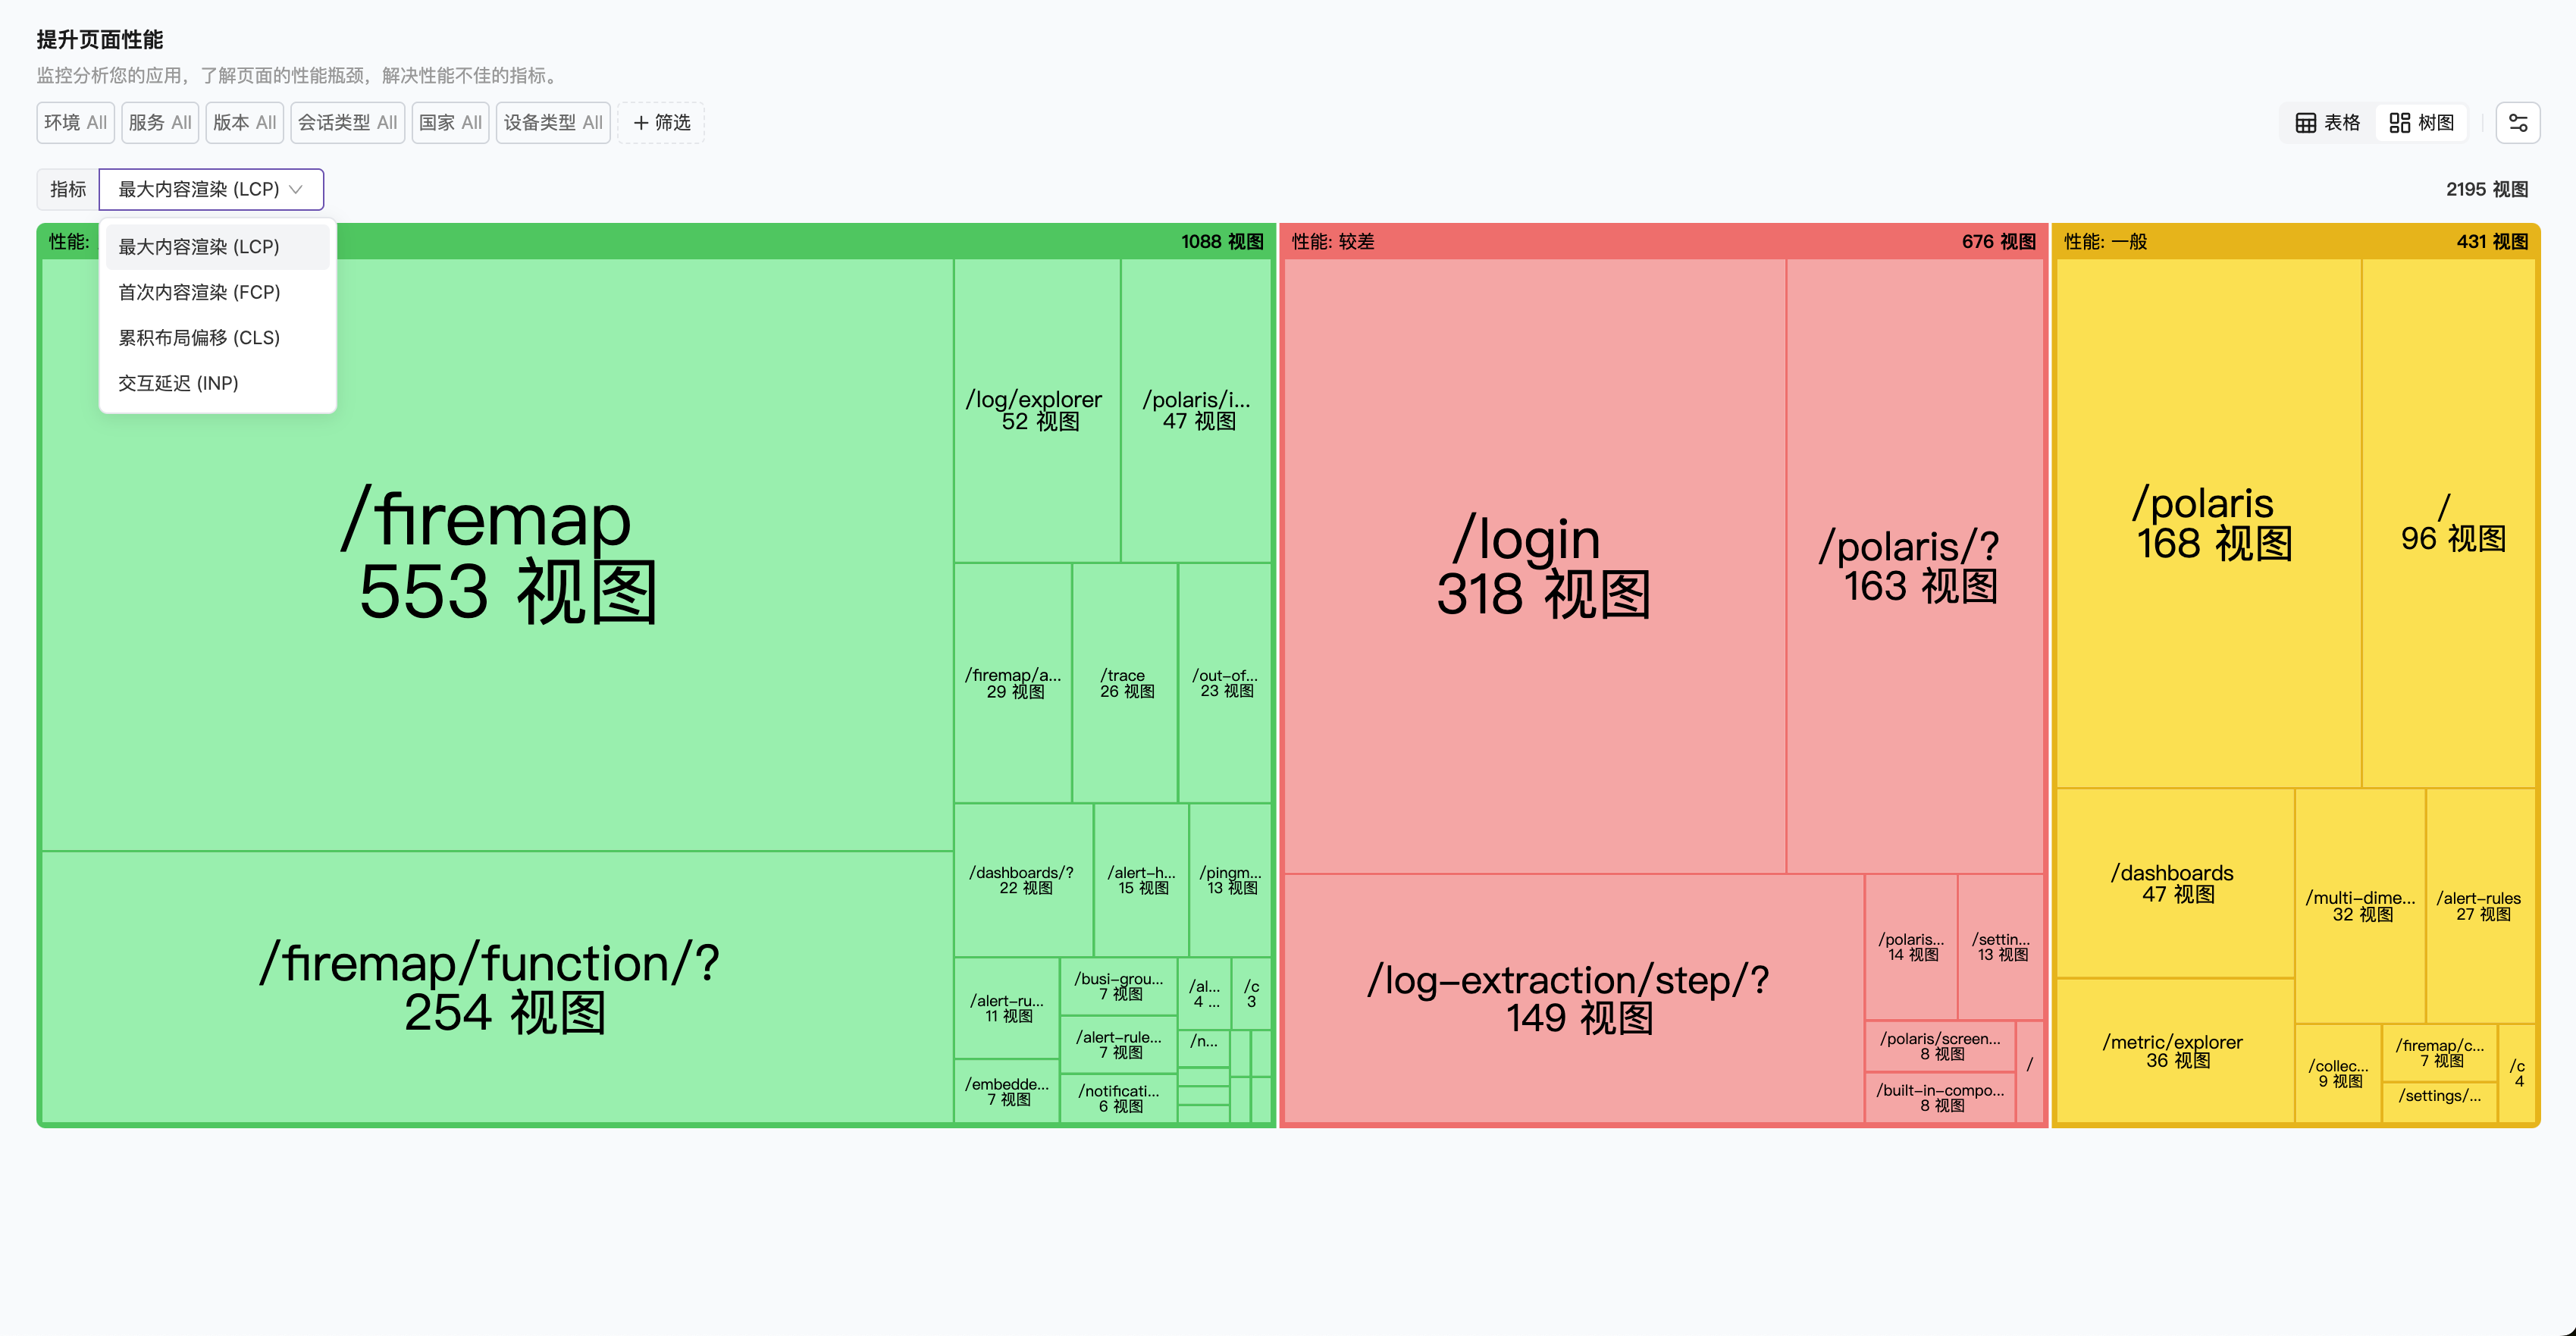
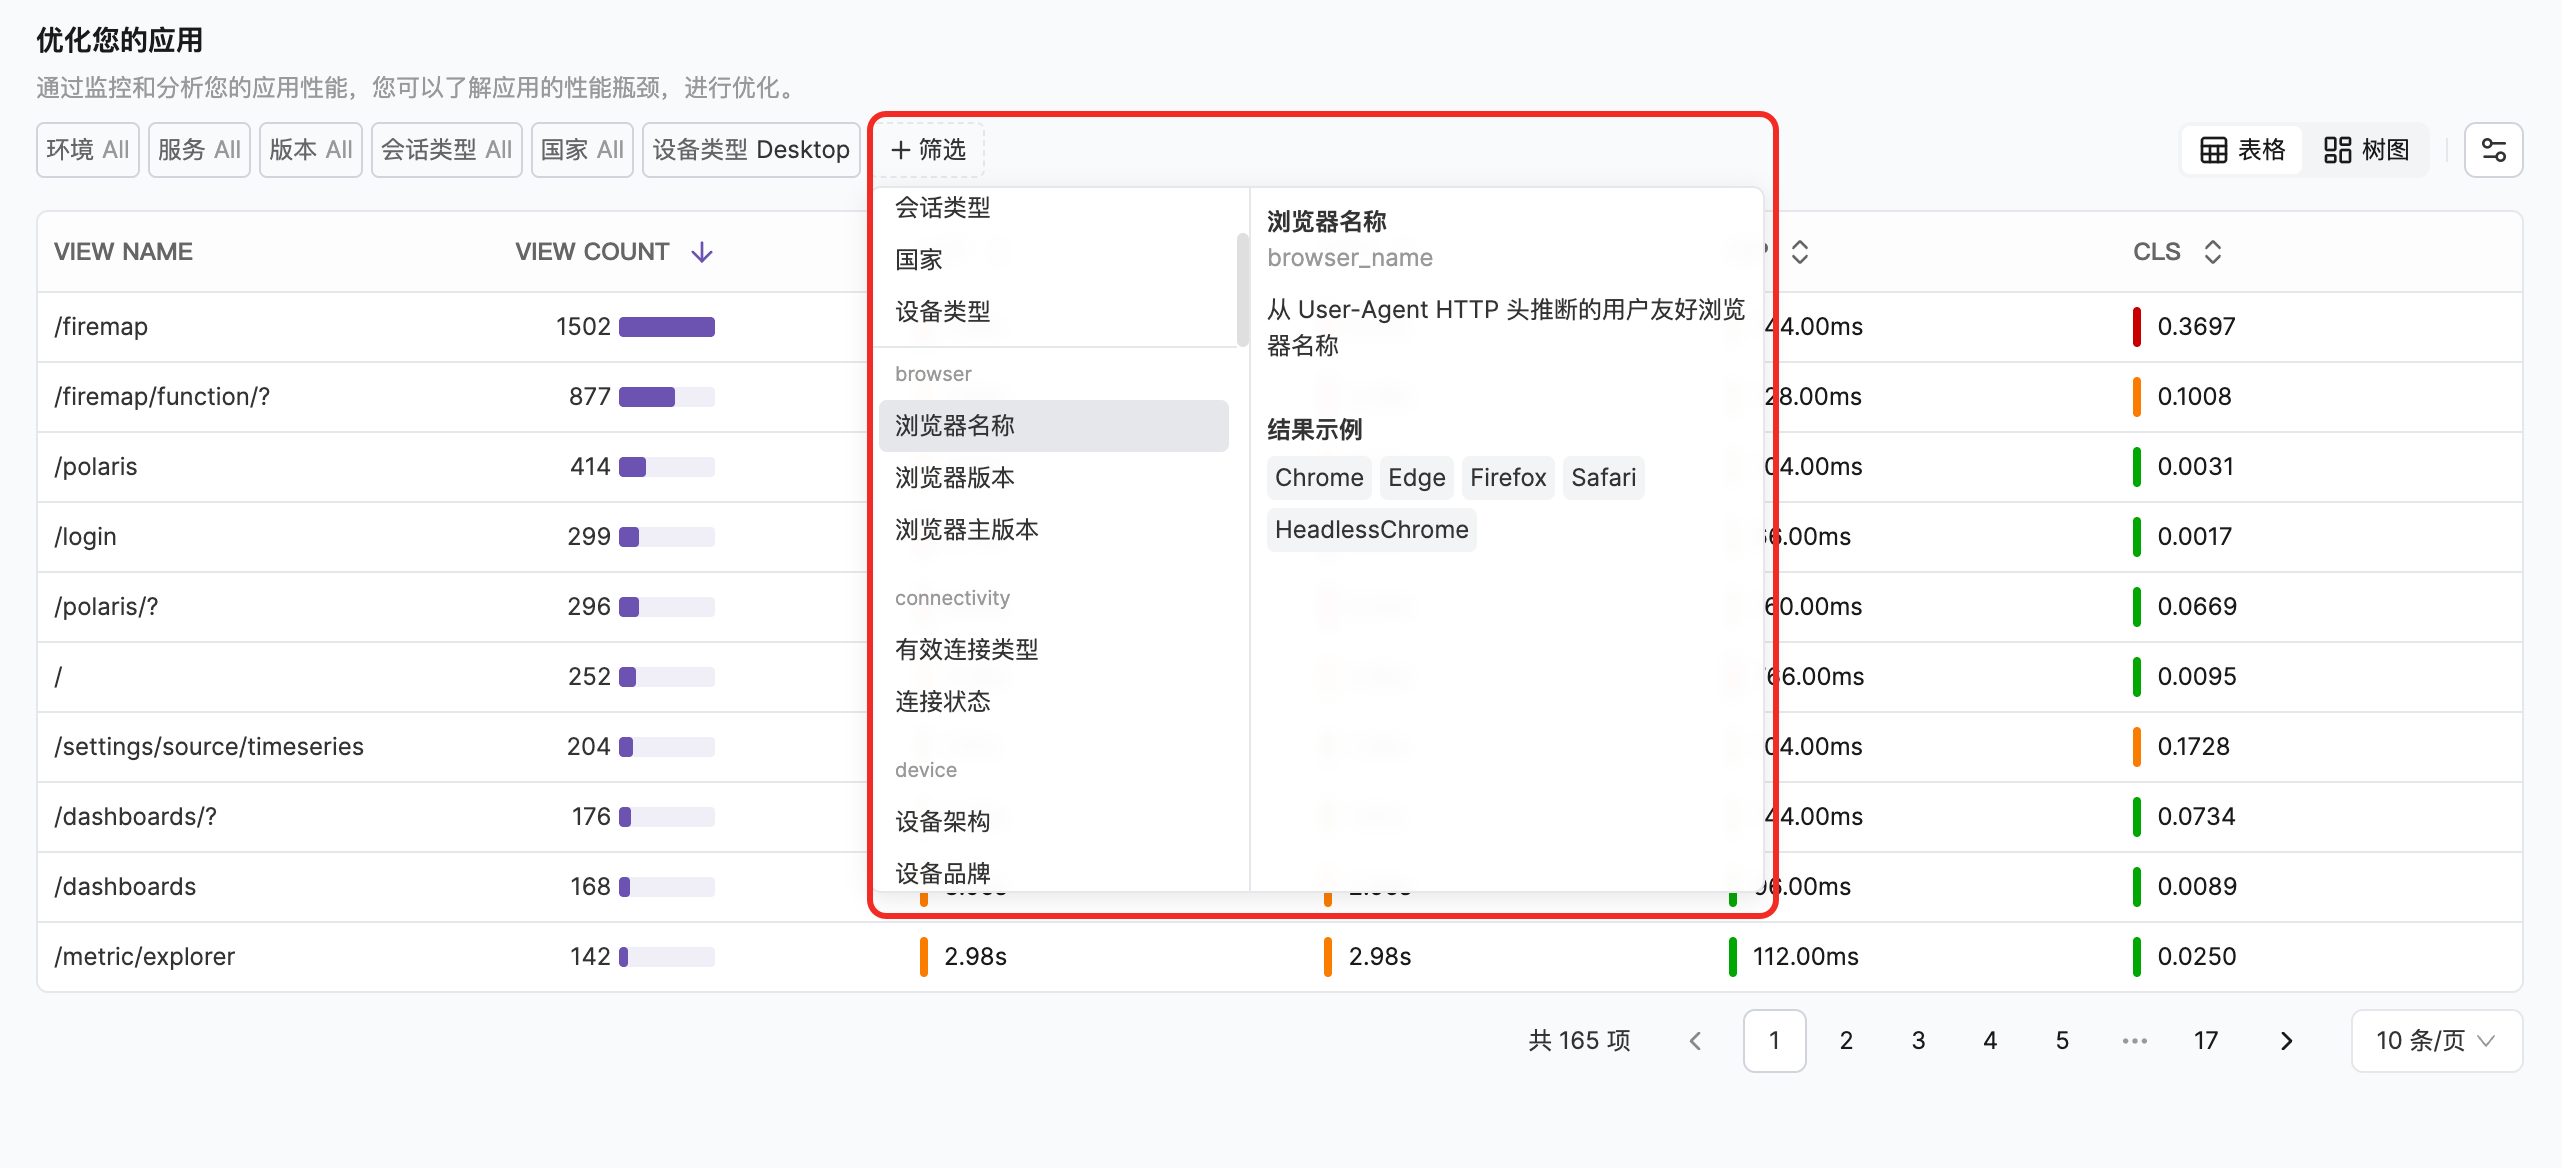
Data Analysis Dimensions
Next Steps


 微信扫码交流
修改于 2025-05-20 03:50:17