
Distributed Tracing
Overview
How It Works
1.
2.
3.
4.
Configuration Steps
1. SDK Configuration
Key Configuration Parameters
allowedTracingUrls: Specifies API endpoints that need trace information addedhttps://api.example.comtrue for successful matchestraceSampleRate: Trace sampling rate, controls what percentage of requests are traced2. Application Management Configuration
1.
2.
3.
4.
提示
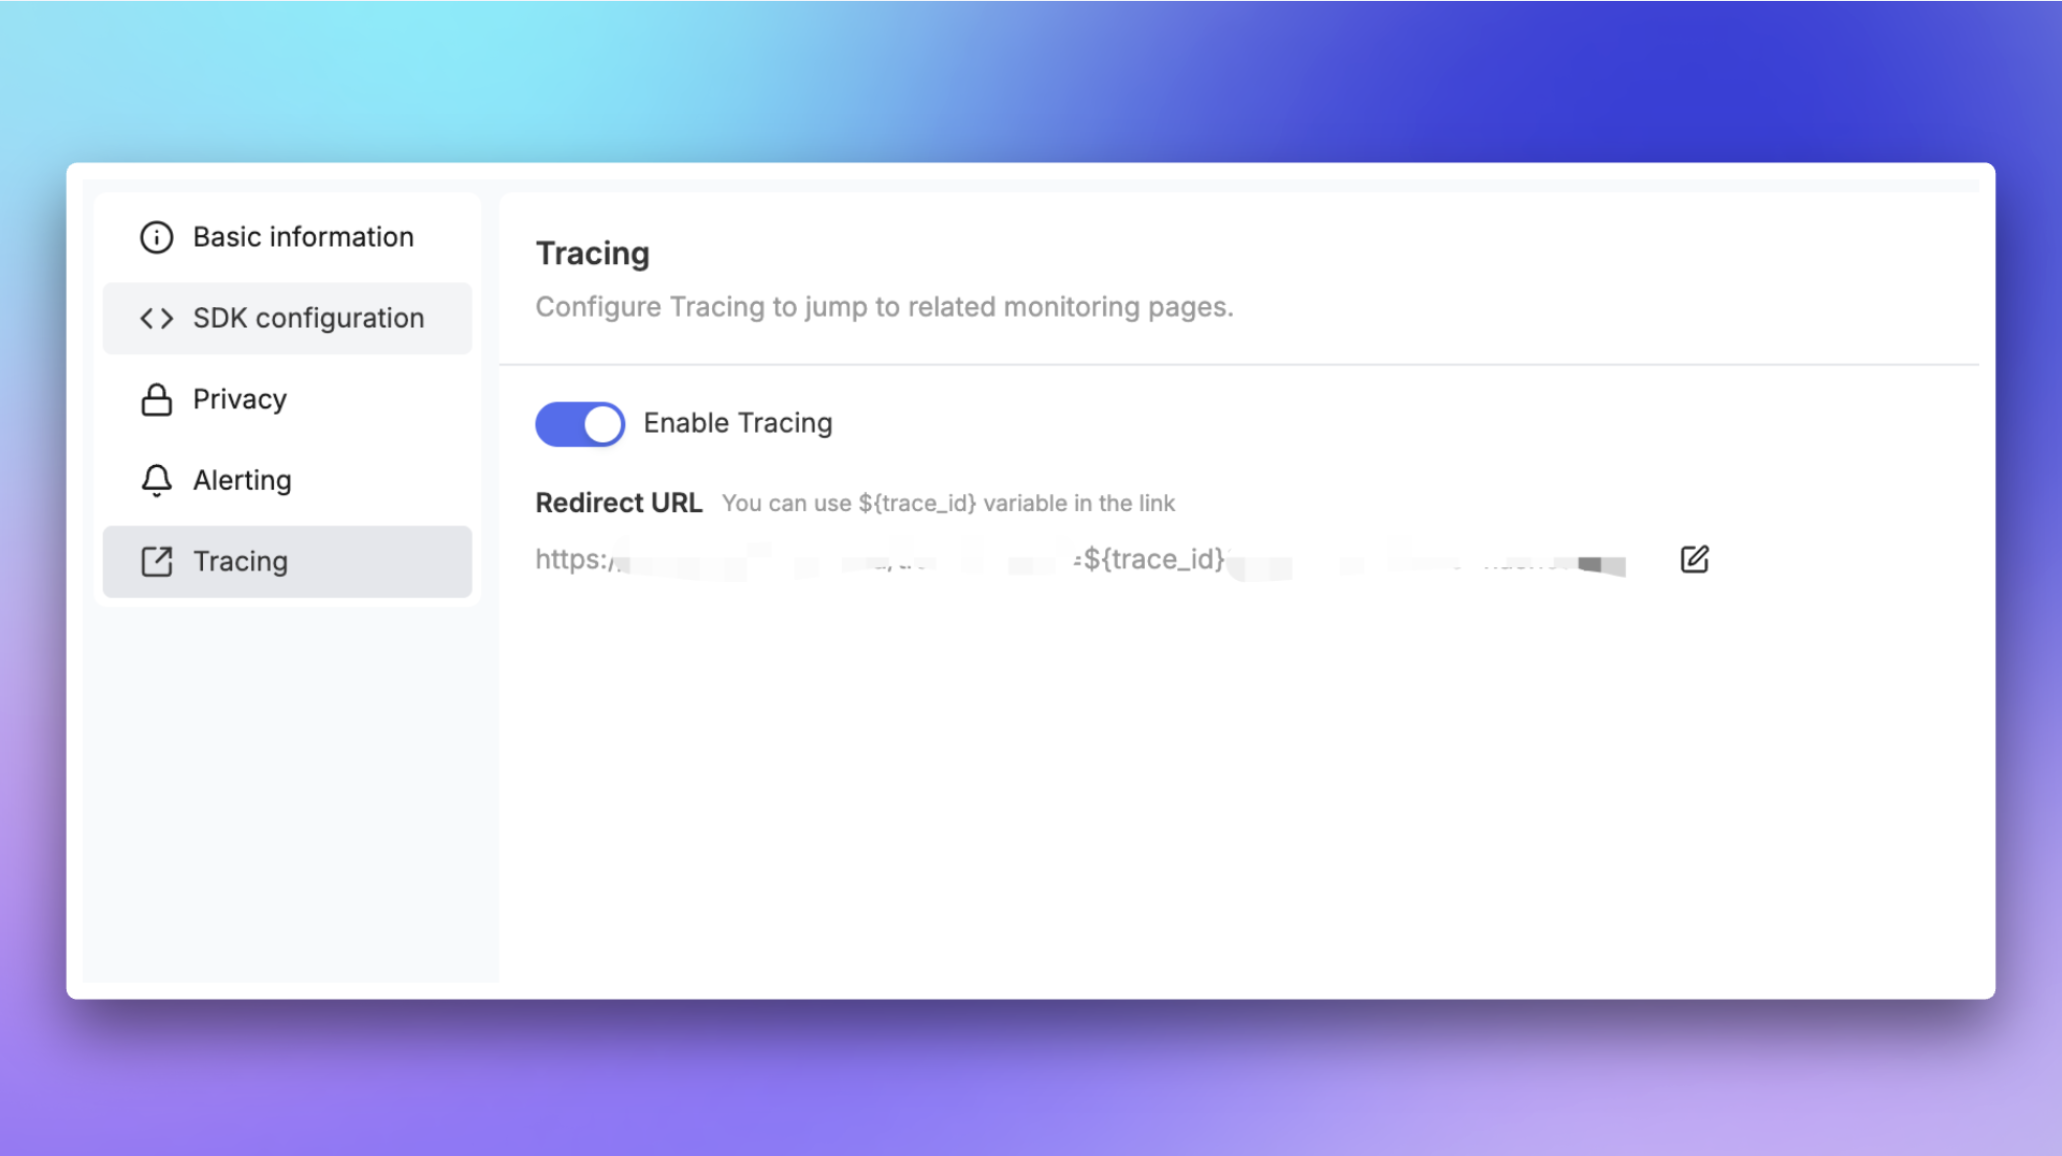
3. Backend Service Configuration
1.
traceparent and tracestate request headers2.
3.
Trace Header Information
traceparent Header
traceparent: 00-00000000000000008448eb211c80319c-b7ad6b7169203331-01[version]-[trace-id]-[parent-id]-[trace-flags]0001 indicates sampled, 00 indicates not sampledtracestate Header
tracestate: dd=s:1;o:rumdd=s:[sampling-priority];o:[origin]1 indicates the trace is sampledrum, indicating collection through RUM SDKUse Cases
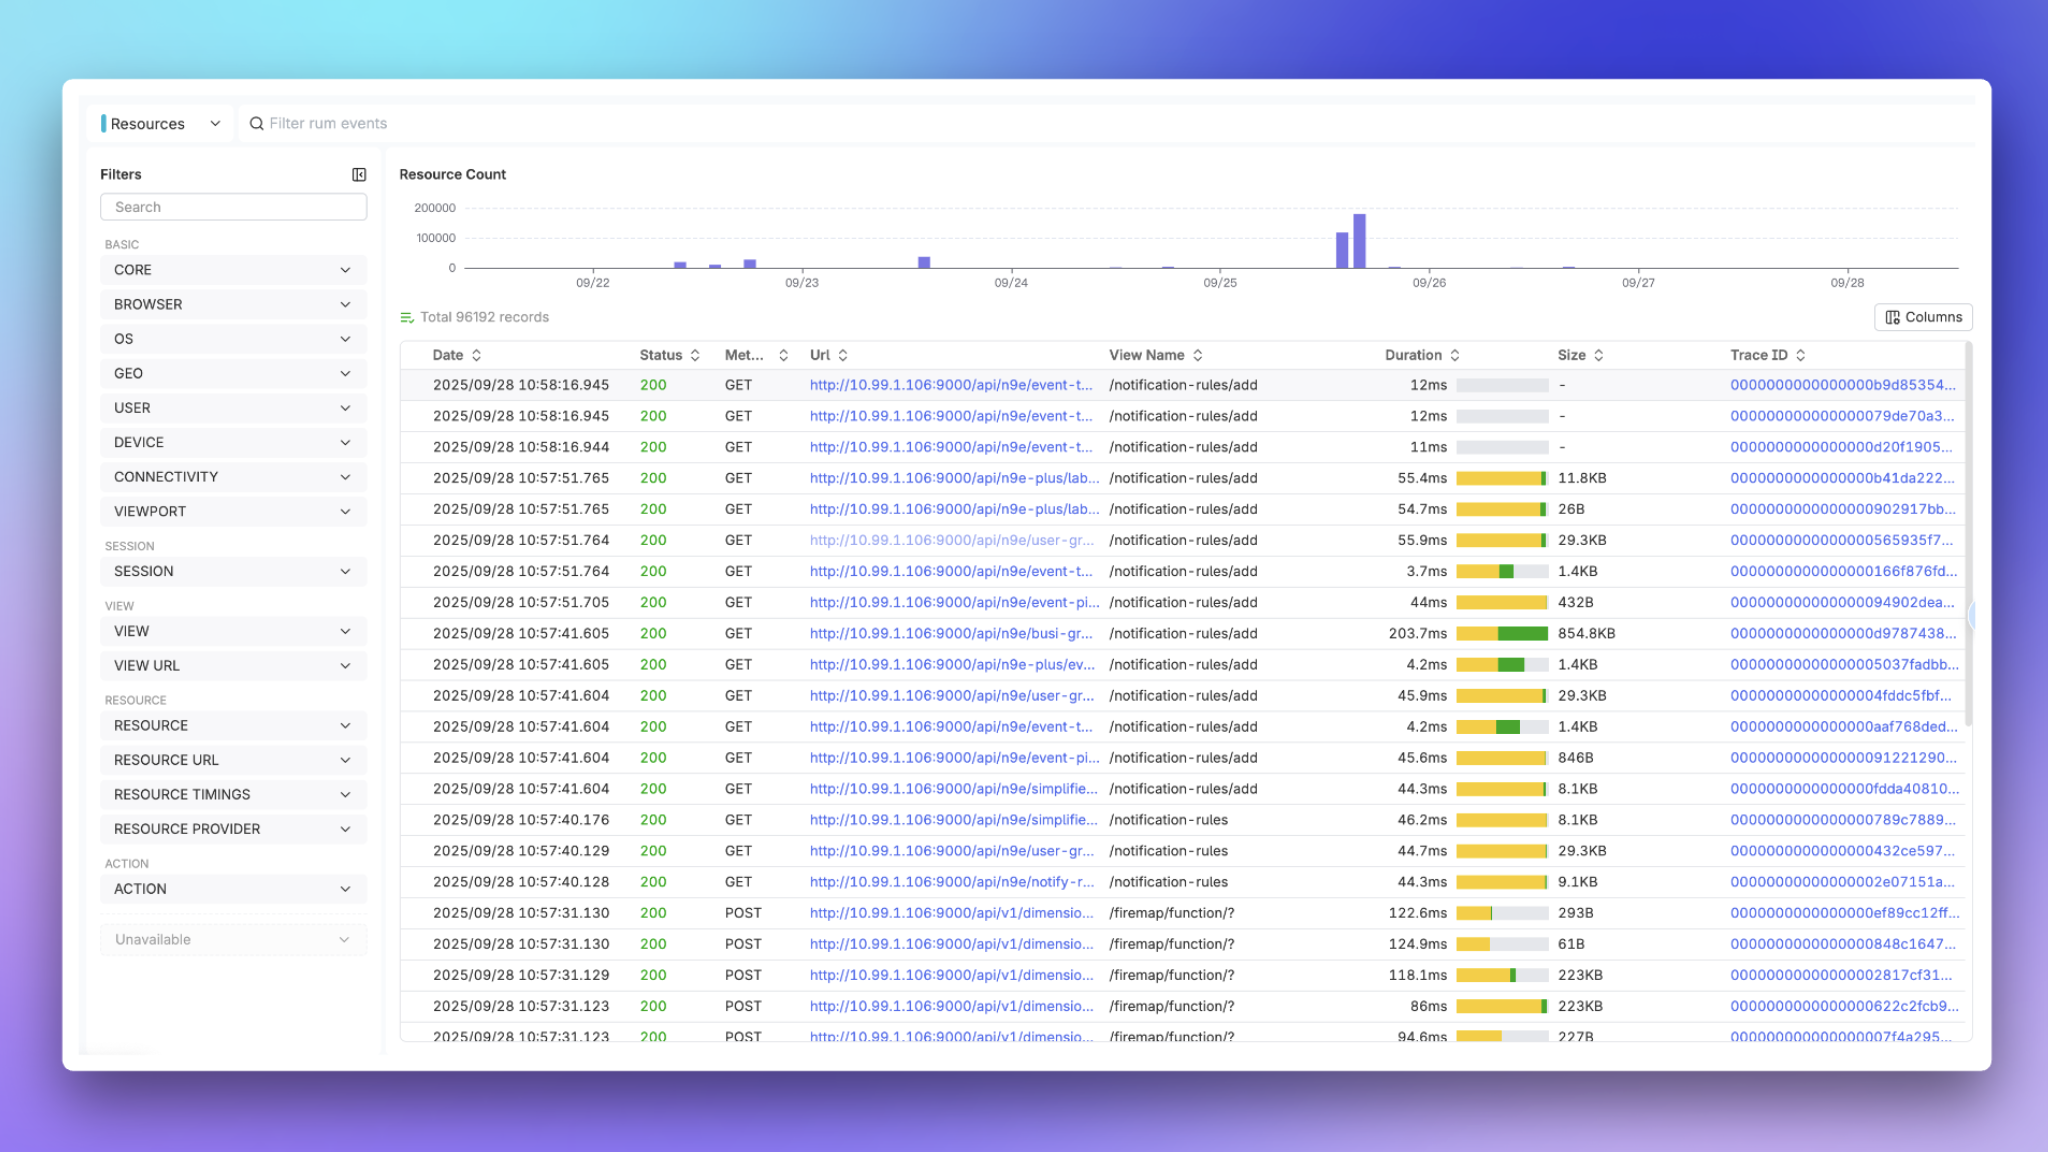
1. Viewing Traces in RUM Session Explorer
1.
2.
3.
4.
2. Finding Resources by trace_id
1.
2.
3.
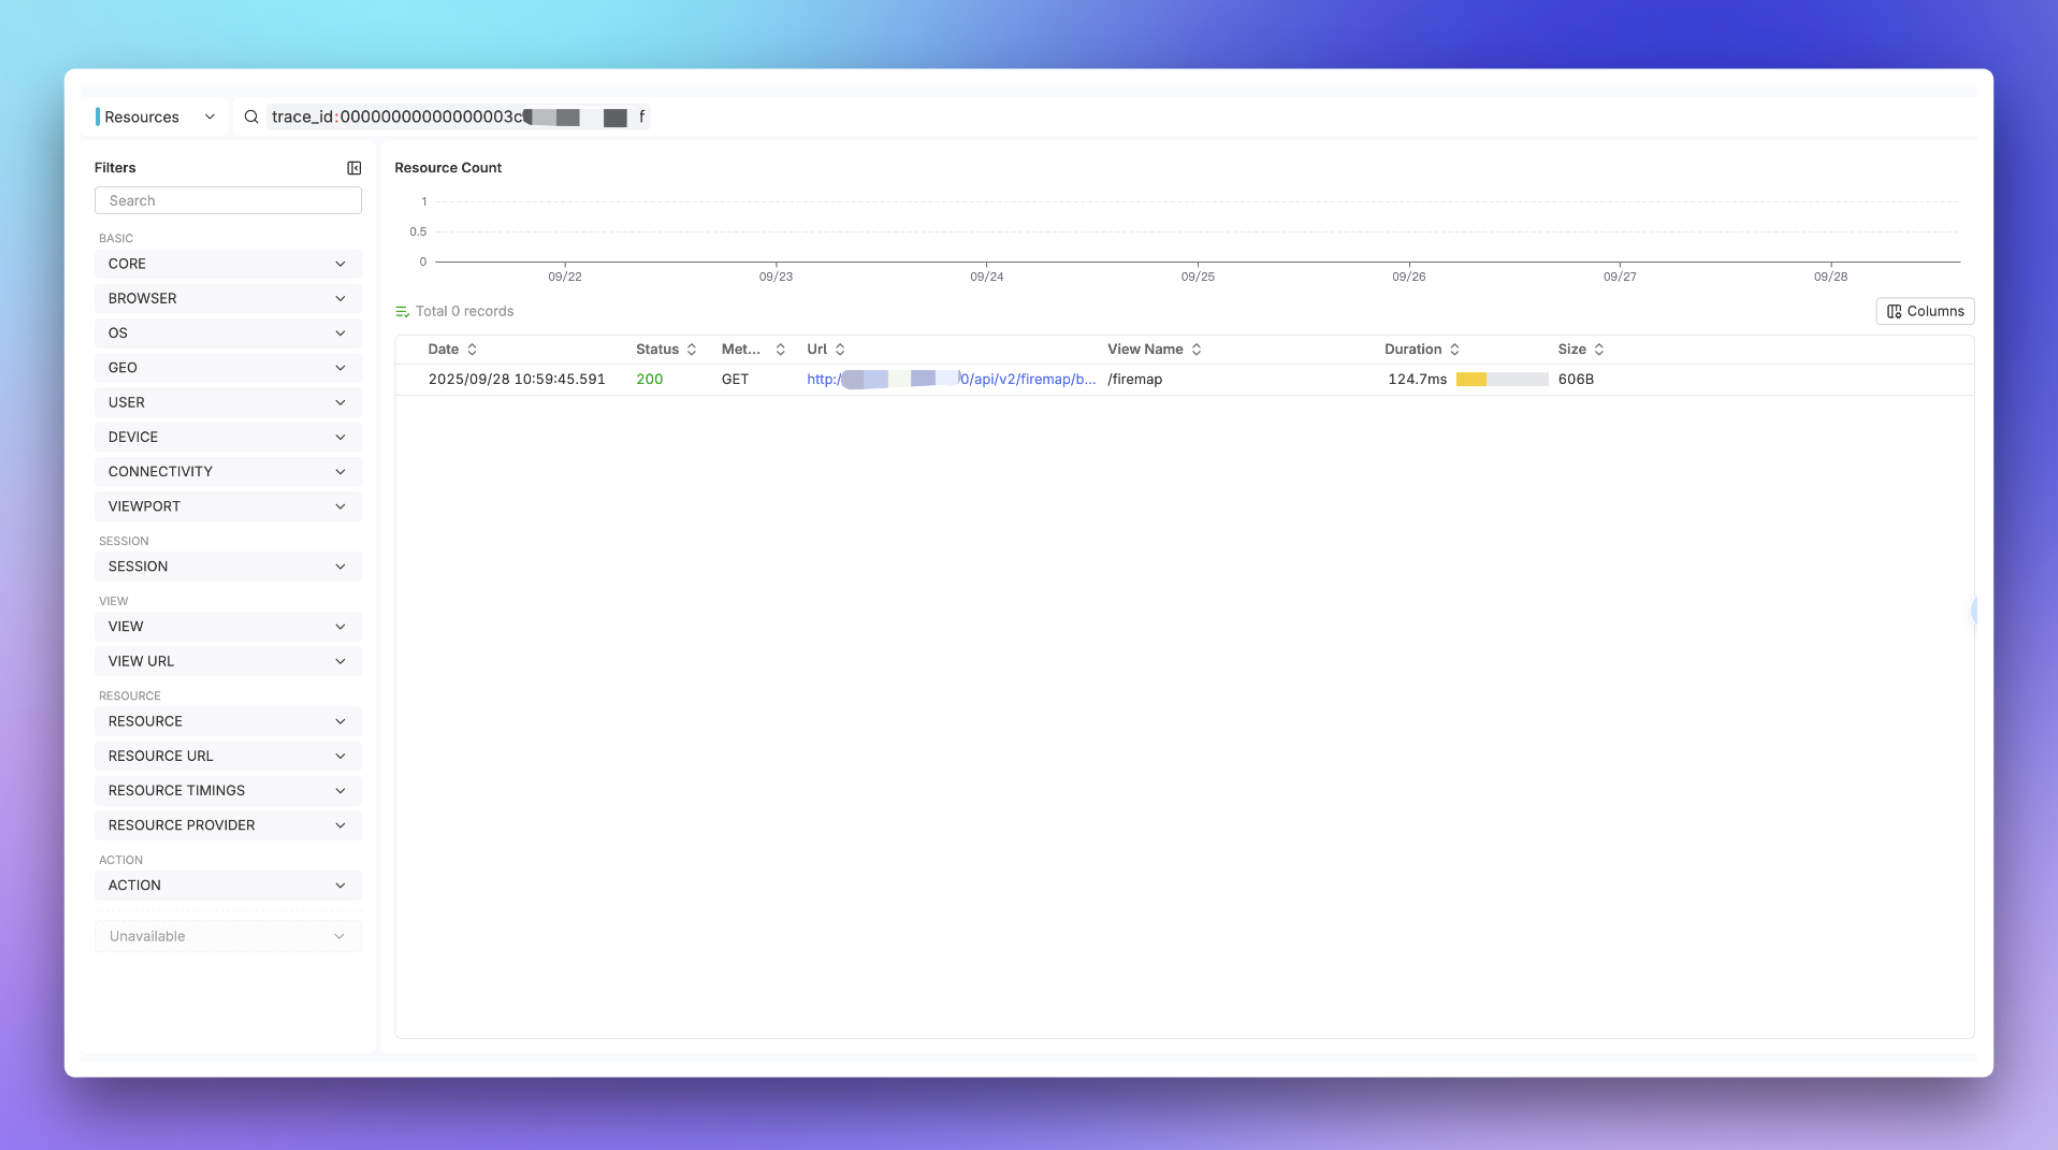
提示
https://console.flashcat.cloud/rum/explorer?appid=${YOUR_APP_ID}&end=${END_TIME}&eventType=resource&queryStr=trace_id%3A${TRACE_ID}&start=${START_TIME}
3. End-to-End Issue Troubleshooting
1.
2.
3.
4.
Best Practices
1. Reasonable Sampling Rate Configuration
2. Precise Tracing URL Configuration
3. Cross-Origin Request Handling
traceparent and tracestate headers are allowed4. Performance Monitoring
Common Issues
Q: Why don't some requests have trace information?
allowedTracingUrls configuration rangetraceSampleRate sampling rateQ: How to verify if trace configuration is correct?
1.
2.
traceparent and tracestate headers3.
Notes
1.
2.
3.
4.
Related Documentation


 微信扫码交流
修改于 2025-09-28 03:10:31