Overview#
Flashduty RUM's session replay functionality helps developers quickly identify problems, analyze user behavior, and optimize product experience by intuitively reproducing user operation paths. Integrated into the RUM SDK, it can be enabled with simple configuration and supports flexible sampling strategies and privacy rule settings. Session replay provides powerful player and Devtools functionality, including operation timelines, error analysis, and context information viewing, helping developers efficiently troubleshoot issues and gain deep insights into user interaction details.Session List#
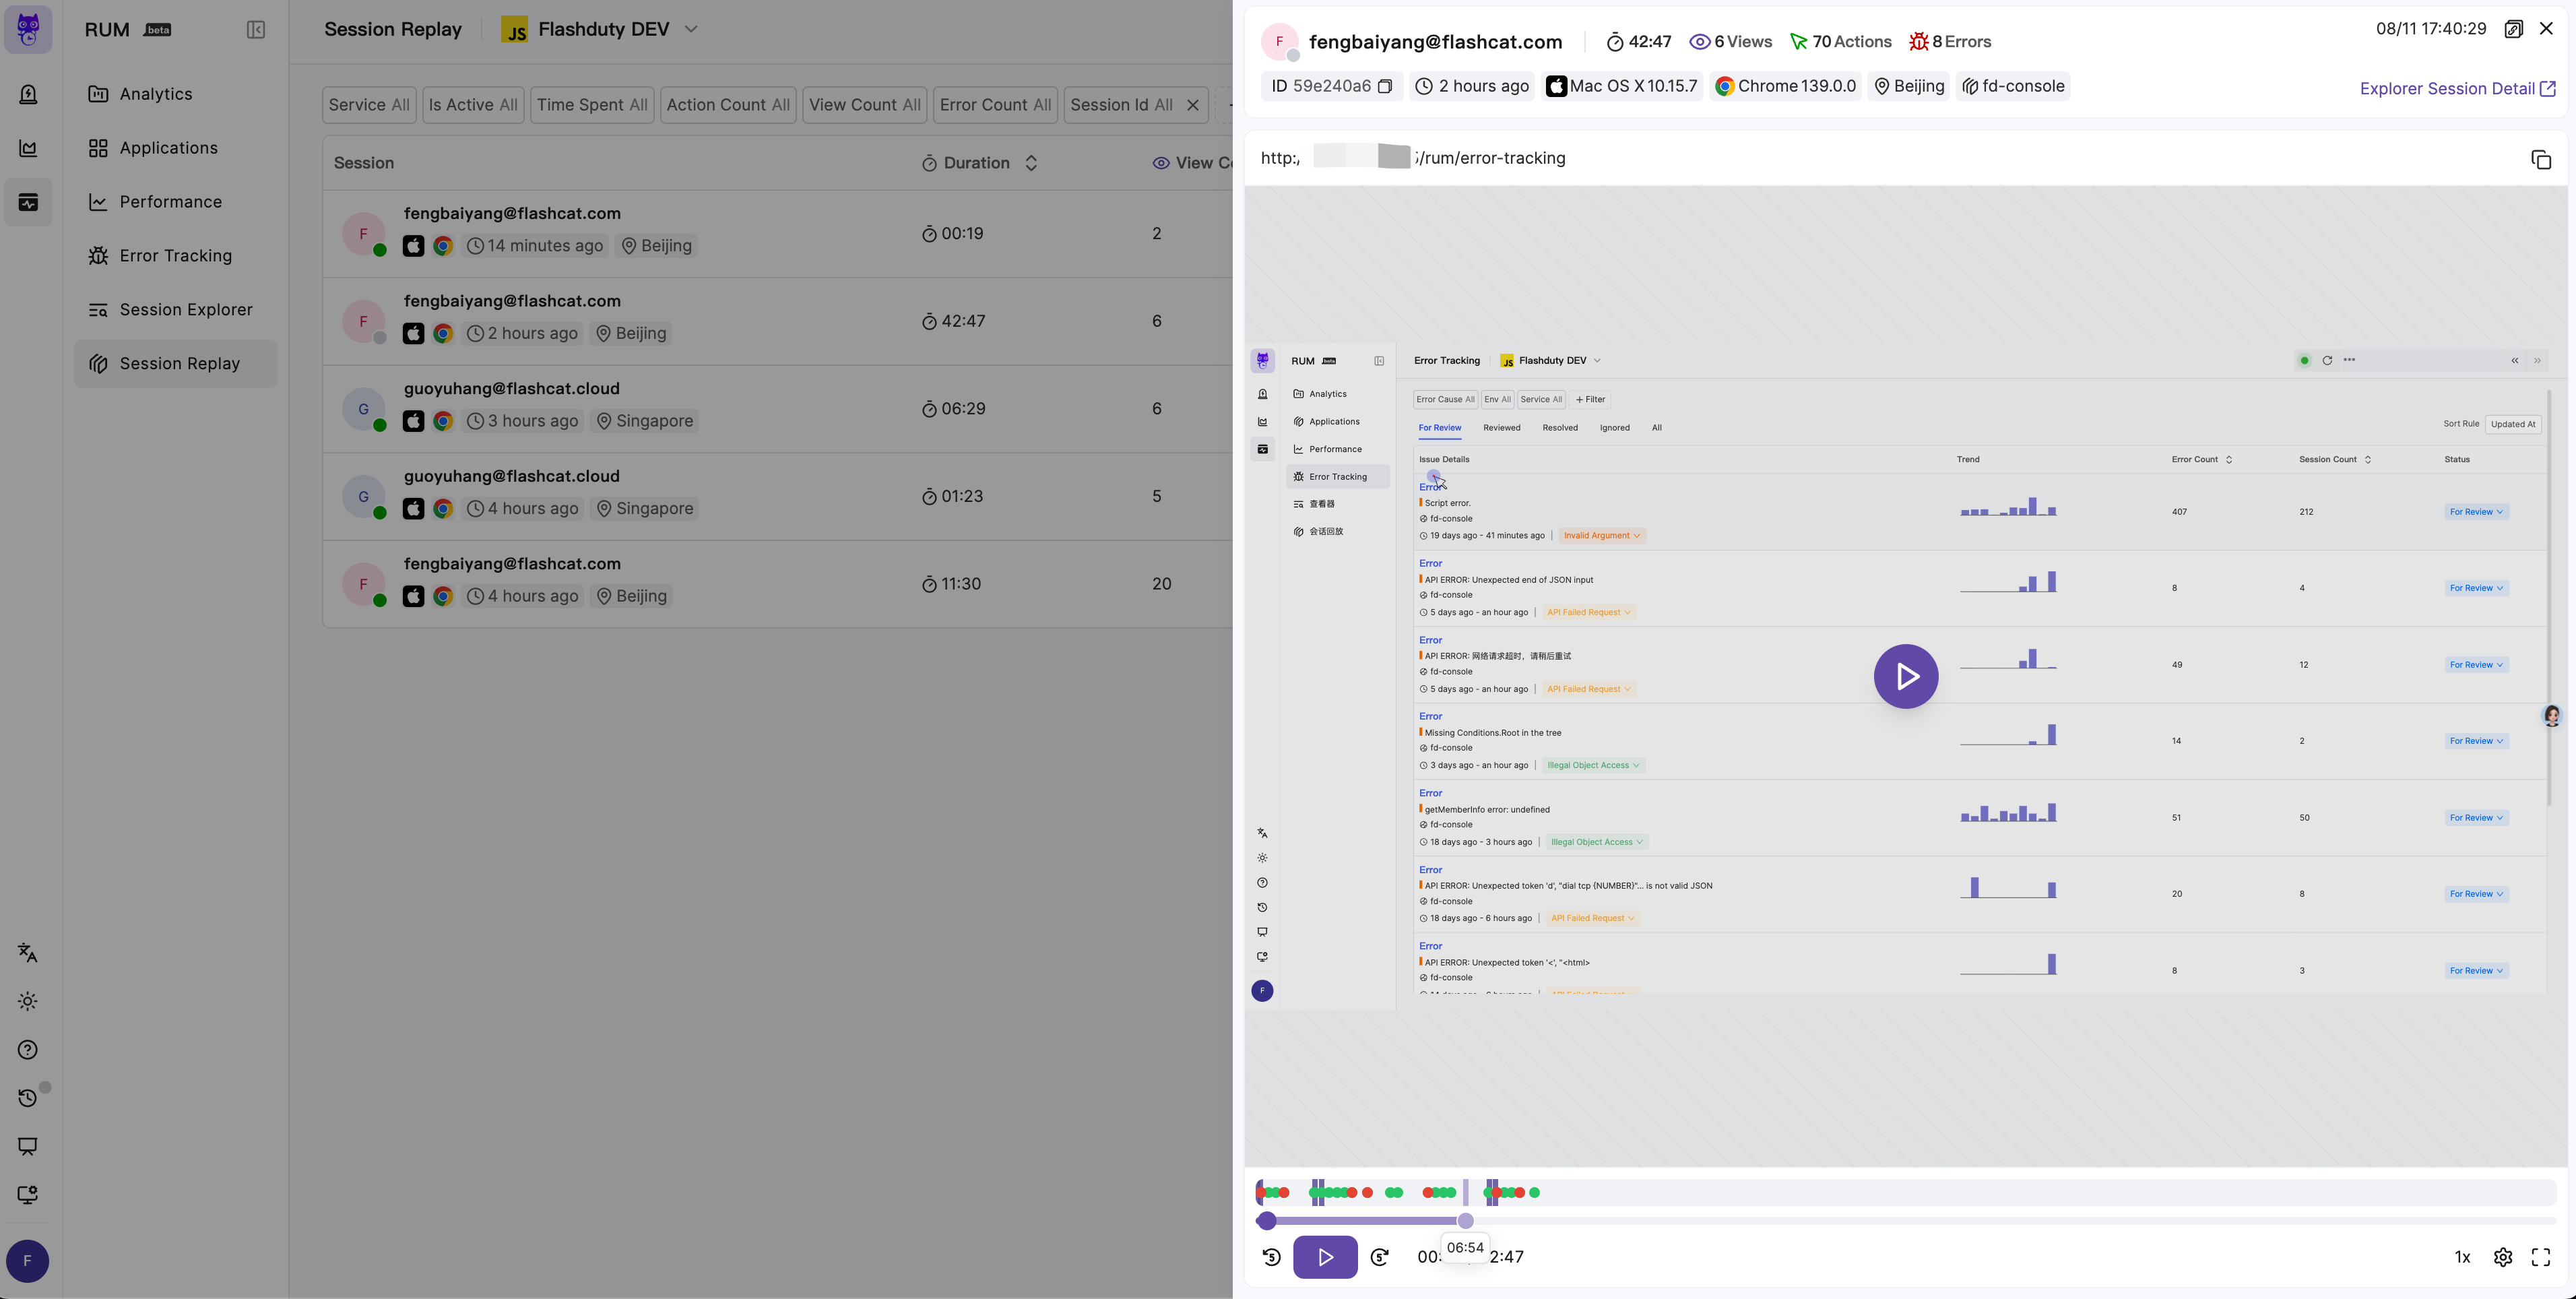
In the "Session Replay" menu, you can view recent session records, sorted by time in descending order by default. It supports sorting by fields such as session duration, view count, behavior count, error count, etc., and provides rich filtering conditions (such as time range, page, tags, etc.) for quickly locating target replay records.Click on any record item to open the player panel, divided into the following areas:Information Display Area: Shows session context information such as access time, start and end pages, tags, etc.
Playback Area: Reproduces operation paths from the user's perspective, clearly displaying user interaction details.
Playback Control Area: Provides playback control functions for convenient operation.
For quick browsing, only replays with a duration greater than 3 seconds are displayed in the list
Player#
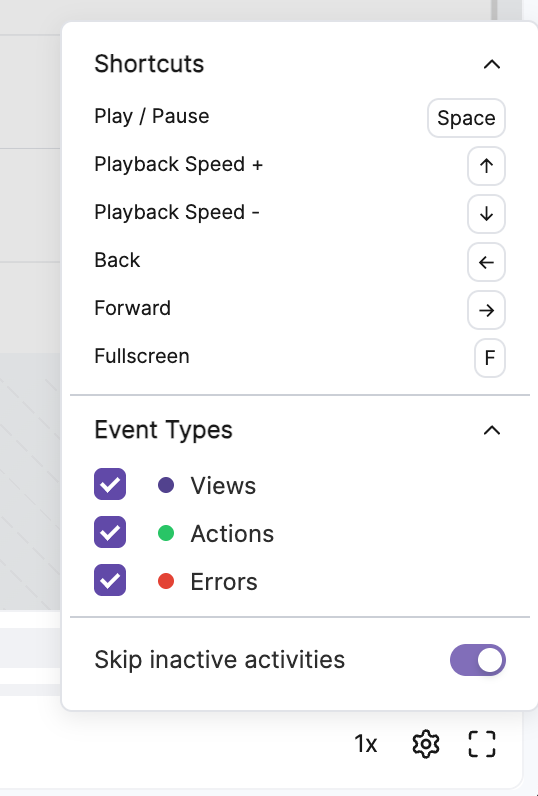
The player supports functions such as play, pause, fast-forward, rewind, replay, speed control, fullscreen, and seek, and supports keyboard shortcuts to improve efficiency. During playback, the timeline will mark user behaviors (Action) and errors (Error) with different colored icons, making it easy to quickly overview key events in the session.
 By default, the player will automatically skip inactive segments to improve viewing efficiency. You can also disable this function through configuration to play completely according to the actual timeline.
 Through the "View All Events and Errors" function, you can enter wide-screen mode to view the session's operation timeline and detailed analysis. Devtools includes the following functions:
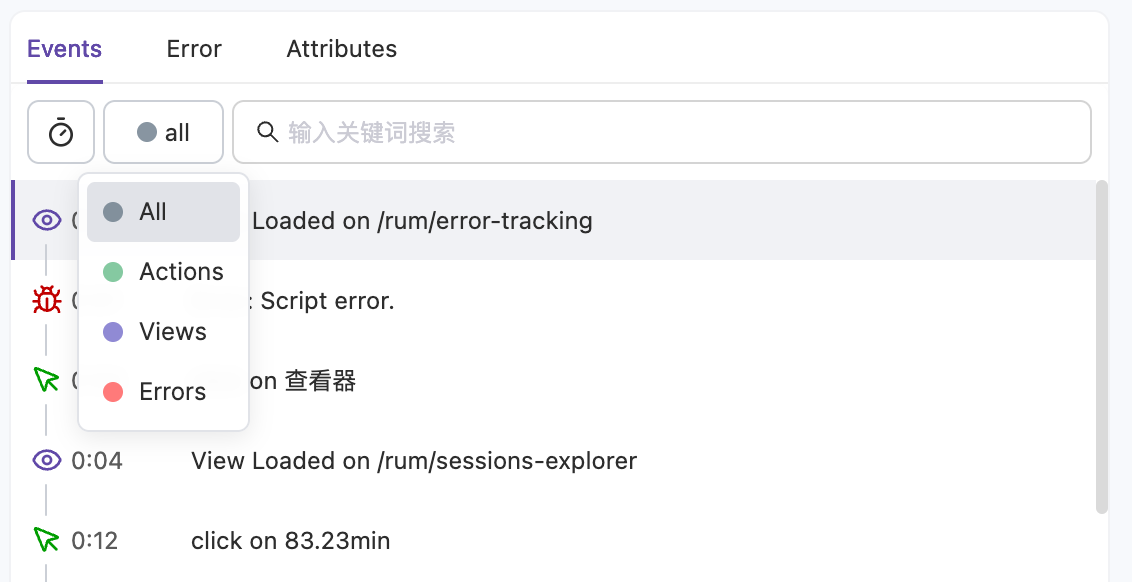
Events Tab: Displays all user operations in the session, supporting the following functions:Switch between relative time and absolute time display.
Filter by event type (such as clicks, page navigation, etc.).
Click on specific events, and the player will automatically jump to the corresponding timestamp.
Error Tab: Lists all errors and issues in the session, supporting click-to-jump to detailed error information for quick identification and analysis.
Attributes Tab: Displays session context information (such as device, browser, geographic location, etc.), helping developers gain deep insights into problem background and perform precise identification.
Next Steps#


 微信扫码交流