Integrate all company alerts into Flashduty to view and handle them in a centralized way.Incident List#
Flashduty provides two entry points to view the incident list: one within the channel, and another under the incident management menu. The difference is that under the incident management menu, you can view incidents from multiple channels or even company-wide incidents.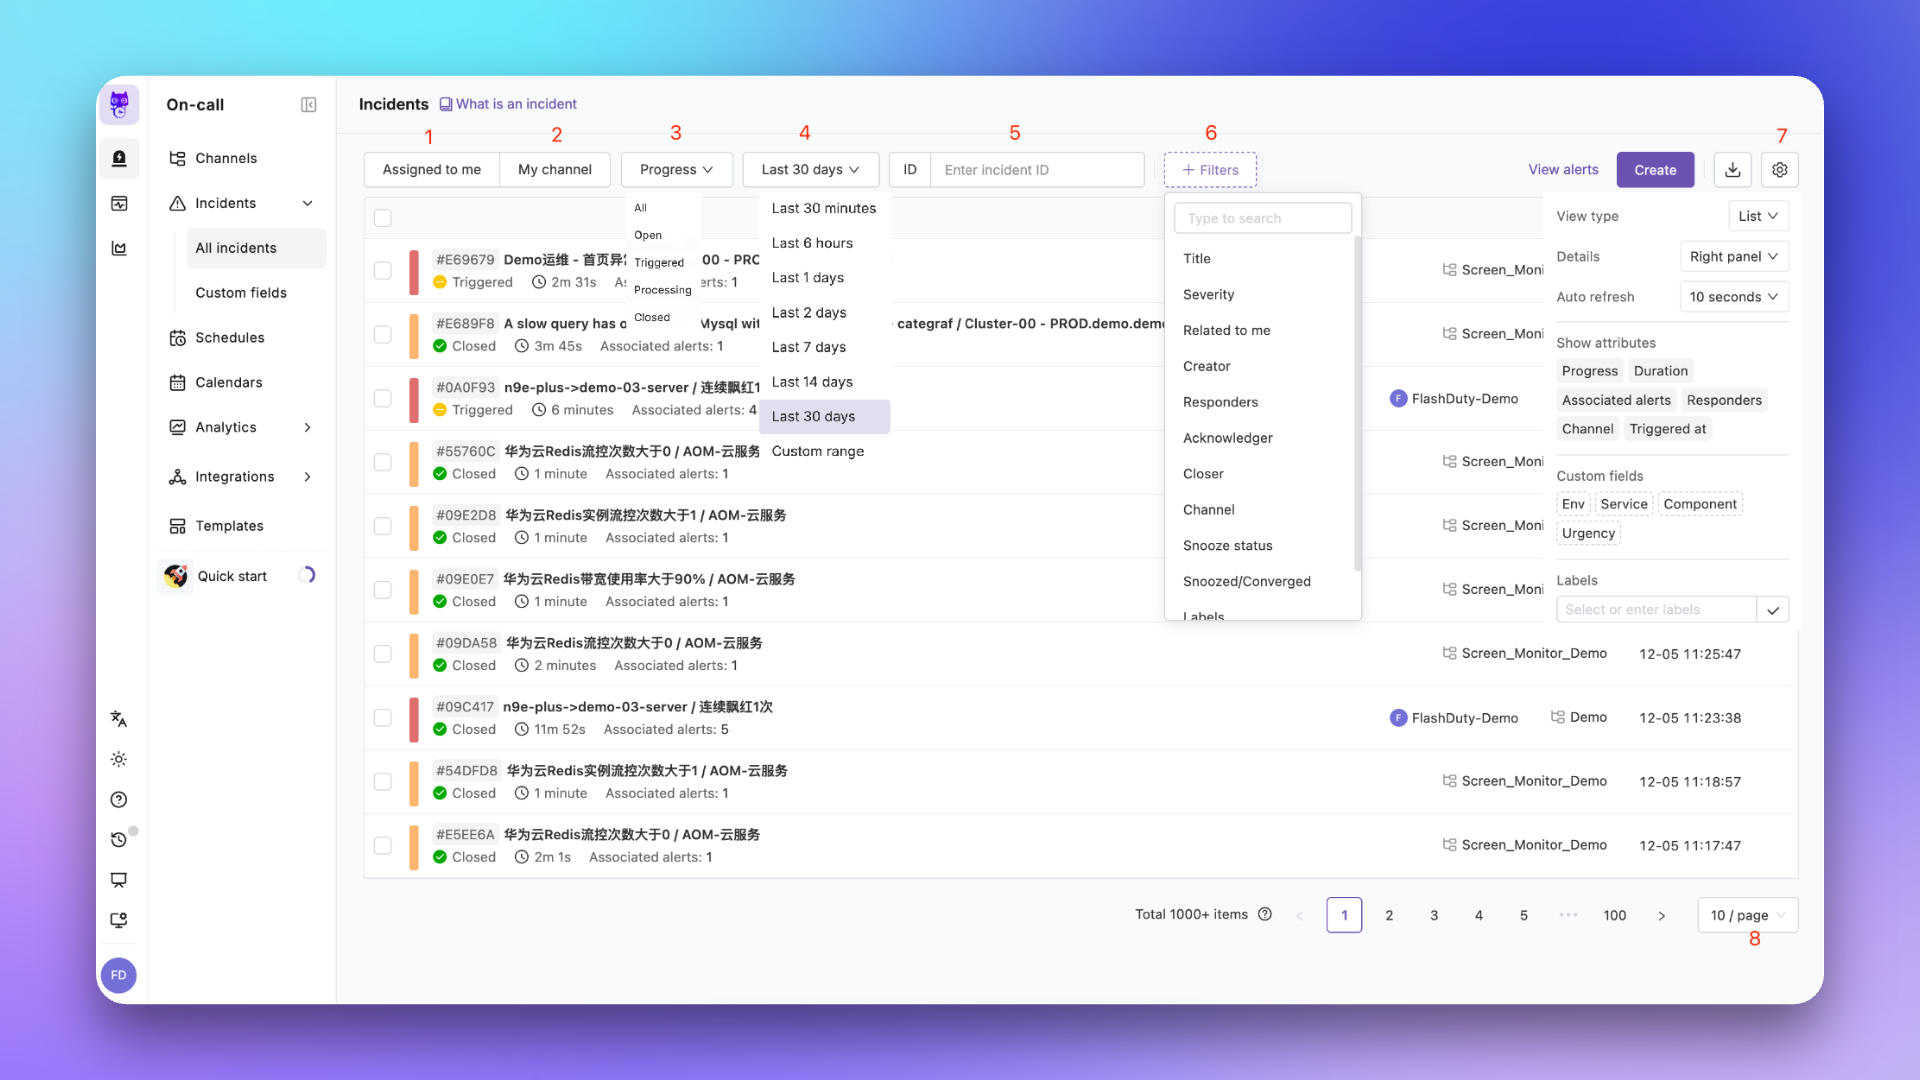
1.
Responders: Default focus is on incidents assigned to me, switchable to view incidents across the entire account.
2.
My Channels: Default focus is on all Channels, switchable to view incidents in My Channels, which refers to My Created and My Managed.
3.
Progress Status: Filter incidents by handling progress, default is All.
4.
Time Filter: Supports relative time and custom interval filtering. Note that for performance reasons, the query period cannot exceed 1 month. To uery data from more than a month ago, adjust the start and end times accordingly.
5.
Search: Supports searching by incident ID, and when responders are set to "assigned to me", also supports fuzzy matching of "incident title".
6.
Advanced Filters: Supports rich dimensional filtering, including severity, labels, or custom fields.
7.
View Settings: Supports various rendering forms, including custom display attributes and group views.
8.
Pagination Settings: Adjust page numbers and items per page.
For performance reasons, when search conditions match more than 1000 incidents, the system only shows 1000+, rather than an exact number. Therefore, you can only view 1000 incidents through pagination. If you need to view more, please adjust your search time interval or use the Incident Query API to get all data. Using Group Views#
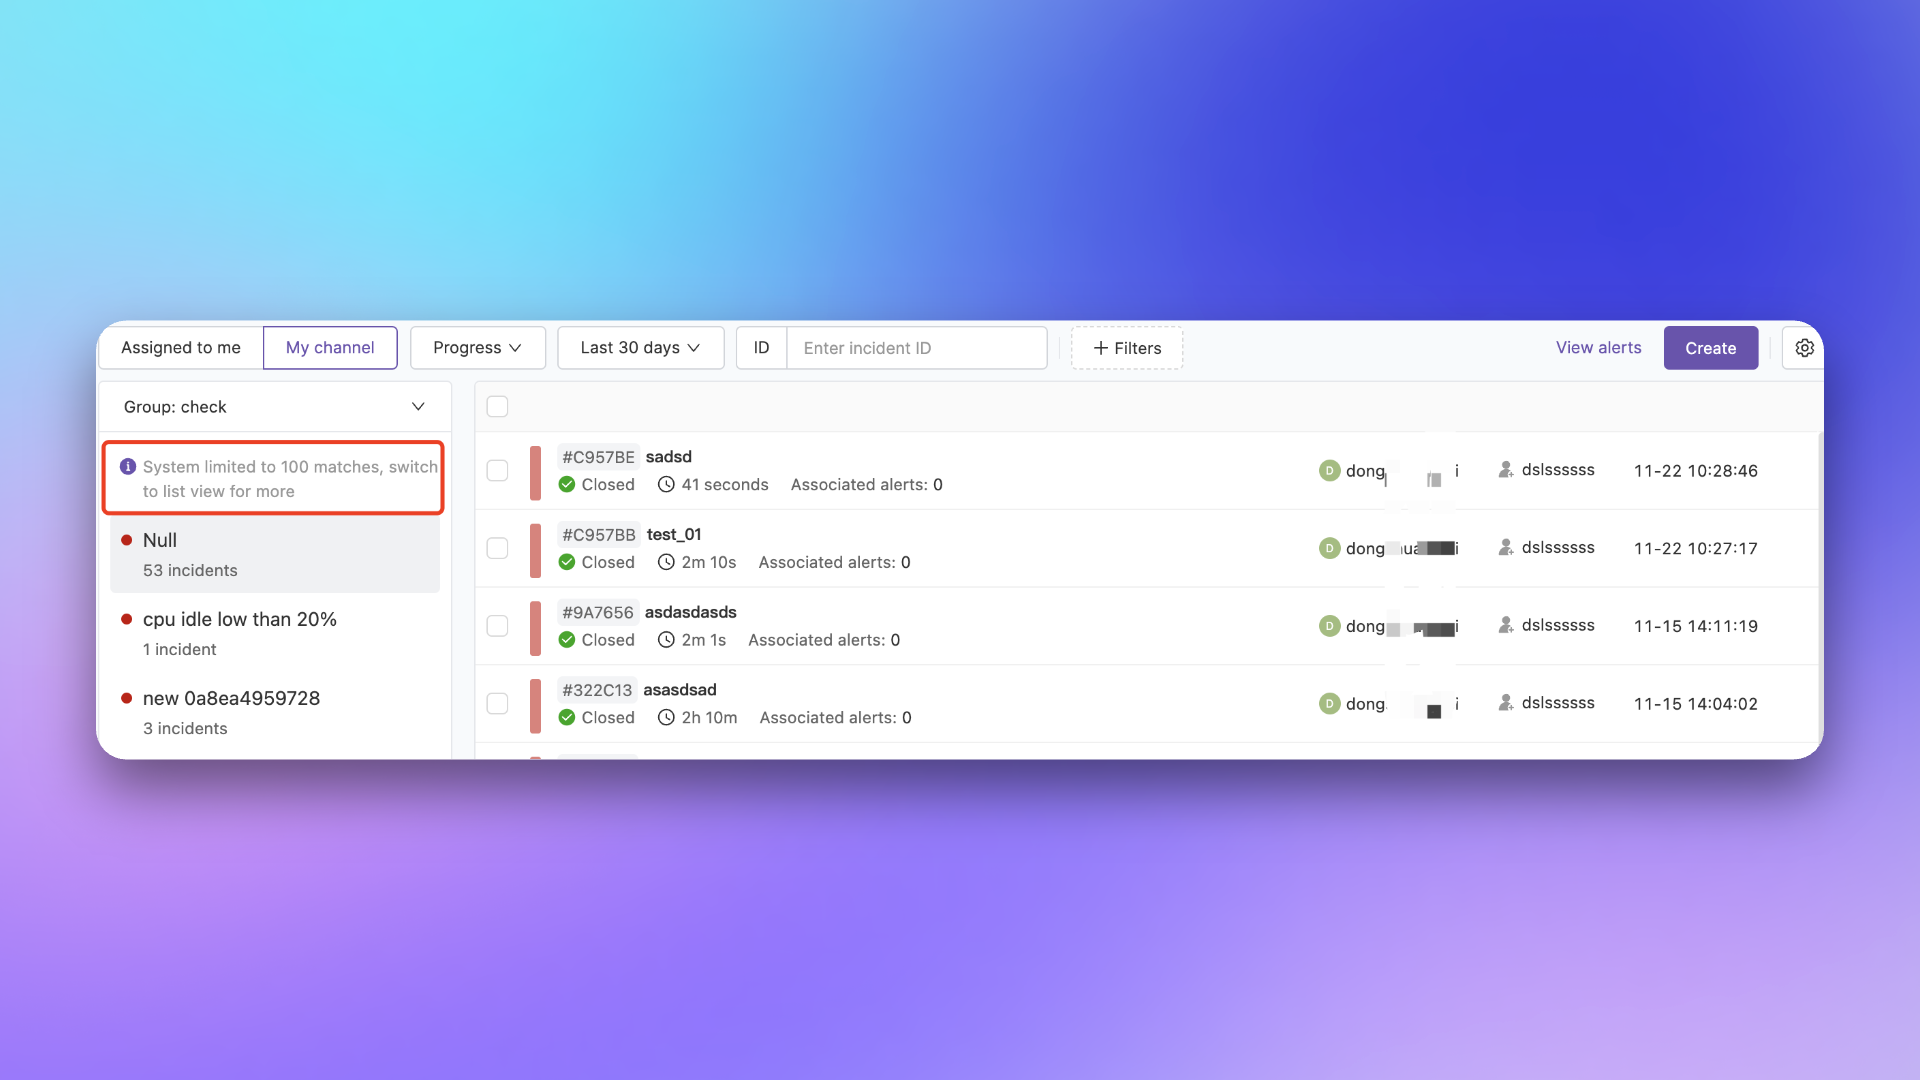
Group views provide a different perspective to view incidents. You can define different grouping dimensions. The essence of grouping dimensions is real-time Group By, such as grouping by severity.For performance reasons, in group view, the system matches a maximum of 100 records for grouping. Therefore, the list page you see may not include all matching data. If this concerns you, please switch to list view.
Using Advanced Filters#
Flashduty provides filtering capabilities across various dimensions with sufficient flexibility. The most typical scenarios are:Search for incidents triggered by the "Host Down" alert policy using check labels.
Search for incidents marked as "false alarm" using the false alarm field.
Flexibility often means lower performance, and this is no exception in Flashduty, despite our extensive performance optimization work. We always recommend narrowing your time query interval and trying to narrow the query scope through conditions like assigned to me and progress status.
Custom Rendering#
Under the Settings Tab, customize the incident list display by selecting or hiding the following content:1.
Basic Attributes: Define whether to show basic information such as duration and responders.
2.
Custom Fields: You can select platform-defined custom fields; if an incident hasn't set this field, it will show "-".
3.
Labels: You can filter and select labels; if an incident doesn't have this label, it will show "-".
Incident Details#
The incident details page is the main entry point for investigating incidents, displaying all available information. Particularly on the incident overview page, Flashduty centrally displays the information you need most.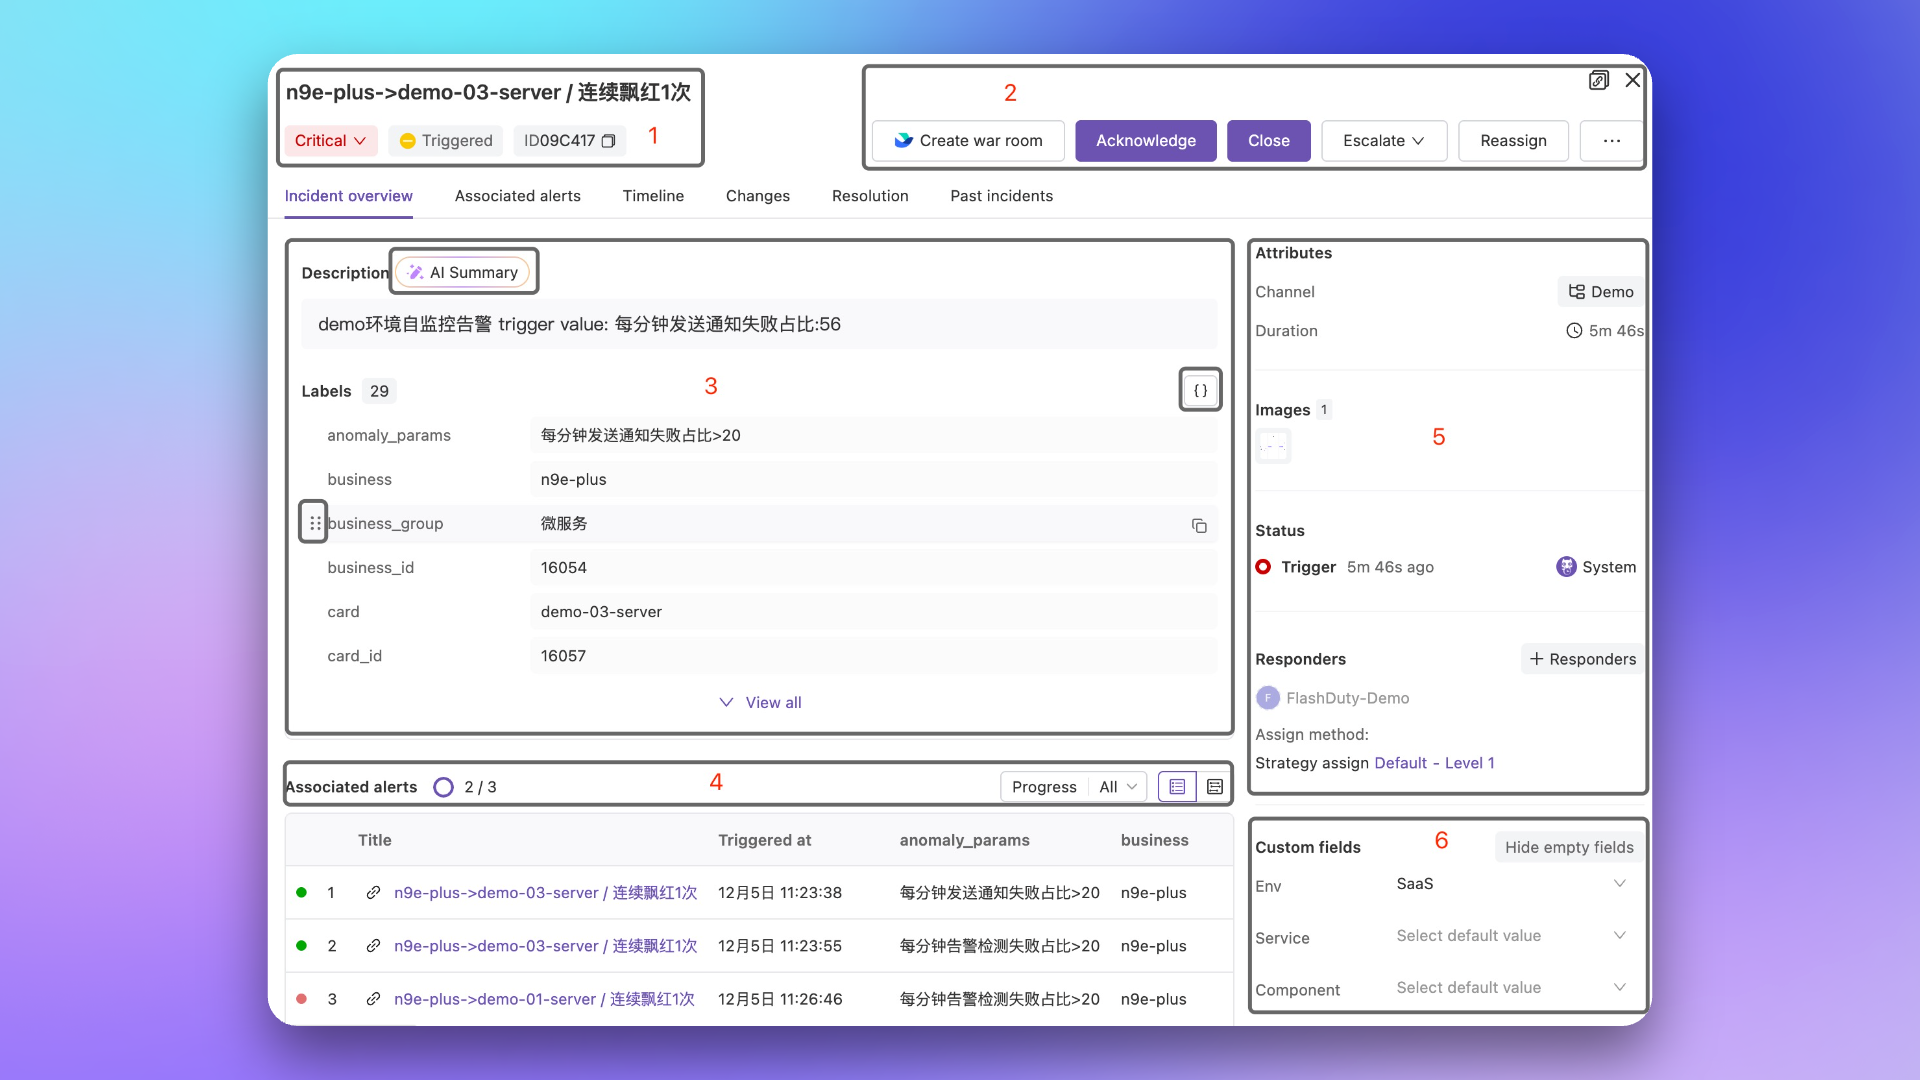
1.
Key Information: Incident title, severity, progress status, ID number.
2.
Operation Area: Various high-frequency operation buttons, with custom operations and low-frequency operation buttons in the more actions menu, where creating a war room requires enabling War Room in IM integration. 3.
Detailed Information: Incident description and label information, where AI summary can quickly extract incident details and output them in three dimensions: event overview, impact scope, and feasible measures. Label content supports drag-and-drop sorting and JSON view display.
4.
Associated Alerts: All alerts associated with the incident that have been aggregated, supporting filtering by processing progress and view switching. 5.
Comprehensive Information: Display the incident's attributes, processing status, images, and handler information. 6.
Custom Fields: Custom field configuration area.
FAQ#
Console error: Due to the large volume of data, we are unable to respond to your request in a timely manner...
This error frequently occurs on incident and alert list queries, insights dashboards, and other pages. It's mainly because the system matched too much data, causing a query timeout.In this case, please narrow your query scope, such as the time interval, or use more precise query conditions. If issues persist, please contact us. 


 微信扫码交流