Flashduty Docs
中文EnglishRoadmapAPI官网控制台
  1. Applications
  • Introduction
  • On-call
    • Getting Started
      • Quick start
      • FAQ
      • Product Comparison
    • Incidents
      • What is an Incident
      • View Incidents
      • Handle Incidents
      • Escalations and Assignments
      • Custom Fields
      • Custom Actions
      • Alert Noise Reduction
      • Past Incidents
      • Outlier Incidents
    • Configure On-call
      • Channels
      • Integrate Alerts
      • Alert Noise Reduction
      • Escalation Rules
      • Label Enrichment
      • Schedules
      • Templates
      • Service Calendars
      • Preferences
      • Alert Routing
      • Silence and Inhibition
      • Filters
      • Notification Bots
      • Alert Pipeline
    • Advanced Features
      • Referencing Variables
      • Dynamic Assignment
      • Insights
    • Integrations
      • Alerts integration
        • Standard Alert Integration
        • Email Integration
        • Nightingale/FlashCat Integration
        • Prometheus Integration
        • Grafana Integration
        • Zabbix Integration
        • Uptime Kuma Integration
        • Alibaba Cloud ARMS Integration
        • Alibaba Cloud Monitor CM Event Integration
        • Alibaba Cloud Monitor CM Metrics Integration
        • Alibaba Cloud SLS Integration
        • AWS CloudWatch Integration
        • Azure Monitor Integration
        • Baidu Cloud BCM Integration
        • Huawei Cloud CES Integration
        • Influxdata Integration
        • Open Falcon Integration
        • PagerDuty Integration
        • Tencent BlueKing Integration
        • Tencent Cloud CLS Integration
        • Tencent Cloud Monitor CM Integration
        • Tencent Cloud EventBridge
        • OceanBase Integration
        • Graylog Integration
        • Skywalking Integration
        • Sentry Integration
        • Jiankongbao Integration
        • AWS EventBridge Integration
        • Dynatrace Integration
        • Huawei Cloud LTS Integration
        • GCP Integration
        • Splunk Alert Events Integration
        • AppDynamics Alert Integration
        • SolarWinds Alert Events Integration
        • Volcengine CM Alert Events Integration
        • Volcengine CM Event Center Integration
        • Volcengine TLS Integration
        • OpManager Integration
        • Meraki Integration
        • Keep Integration
        • ElastAlert2 Alert Integration
        • StateCloud Alert Events
        • Guance Alert Events
        • Zilliz Alert Events
        • Huawei Cloud APM Alerts
        • zstack integration
      • Change integration
        • Standard Change Event
        • Jira Issue Events
      • IM integration
        • Feishu (Lark) Integration Guide
        • Dingtalk Integration
        • WeCom Integration
        • Slack Integration
        • Microsoft Teams Integration
      • Single Sign-On
        • Authing Integration
        • Keycloak Guide
        • OpenLDAP Guide
      • Webhooks
        • Alert webhook
        • Incident webhook
        • Costom action
  • RUM
    • Getting Started
      • Introduction
      • Quick start
      • FAQ
    • Applications
      • Applications
      • SDK Integration
      • Advanced Configuration
      • Analysis Dashboard
    • Performance Monitoring
      • Overview
      • Metrics
      • Performance Analysis
      • Performance Optimize
    • Error Tracking
      • Overview
      • Error Reporting
      • Issues
      • Source Mapping
      • Error Grouping
      • Issue States
      • Issue Alerting
    • Others
      • Terminology
      • Data Collection
      • Data Security
  • Platform
    • Teams and Members
    • Permissions
    • Single Sign-On
  • Terms
    • Terms of Service
    • User Agreement/Privary Policy
    • SLA
    • Data Security
  1. Applications

Analysis Dashboard

Overview#


Flashduty RUM analysis dashboard provides out-of-the-box visualization dashboards that automatically collect and analyze multi-dimensional data including user sessions, performance, resources, and errors, helping you fully understand your application's real-world performance, quickly locate performance bottlenecks and abnormal issues, and continuously optimize user experience.
The analysis dashboard primarily includes 4 analytical dimensions: Overview, Performance Analysis, Error Analysis, and Resource Analysis.

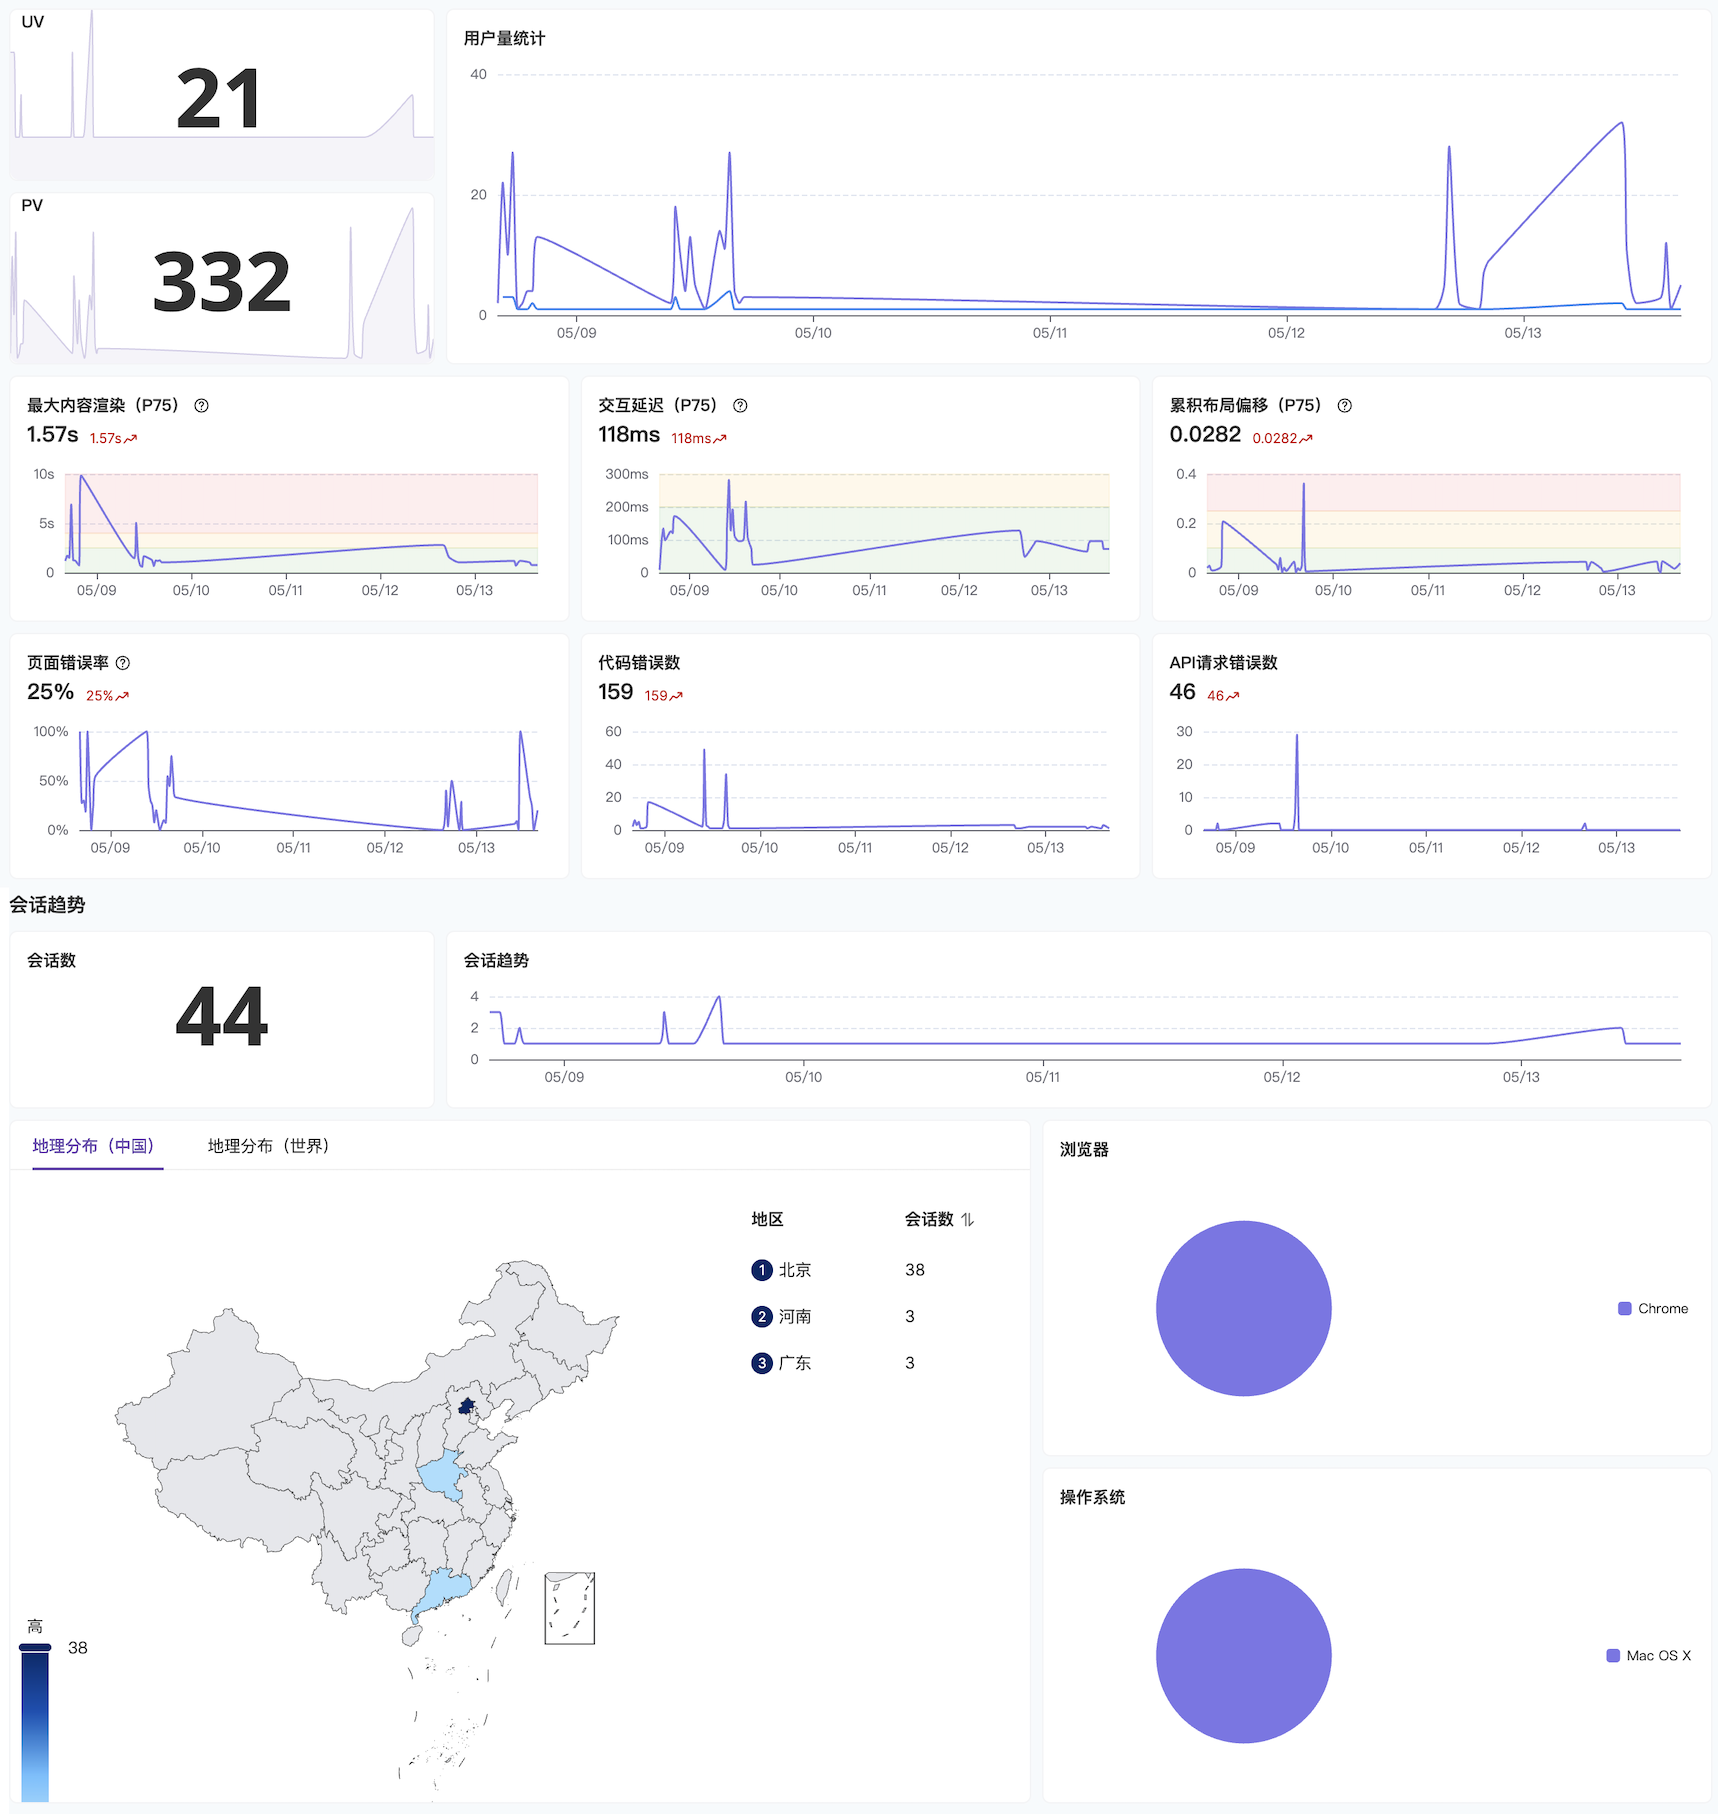
1. Overview — Key Metrics at a Glance#

2025-05-14-11-42-19
The overview module focuses on the core metrics of your application across multiple dimensions, including:
Traffic Metrics: Monitor PV (page views), UV (unique visitors), and session count to help you grasp overall access trends.
User Distribution: Combine geographic location, device type, and other information to gain insights into user sources and active regions.
Health and Performance Metrics: Highlight three browser performance metrics: Largest Contentful Paint, First Input Delay, and Cumulative Layout Shift.
Anomalies and Errors: Statistics on various error rates to quickly identify potential risk points and ensure application stability.

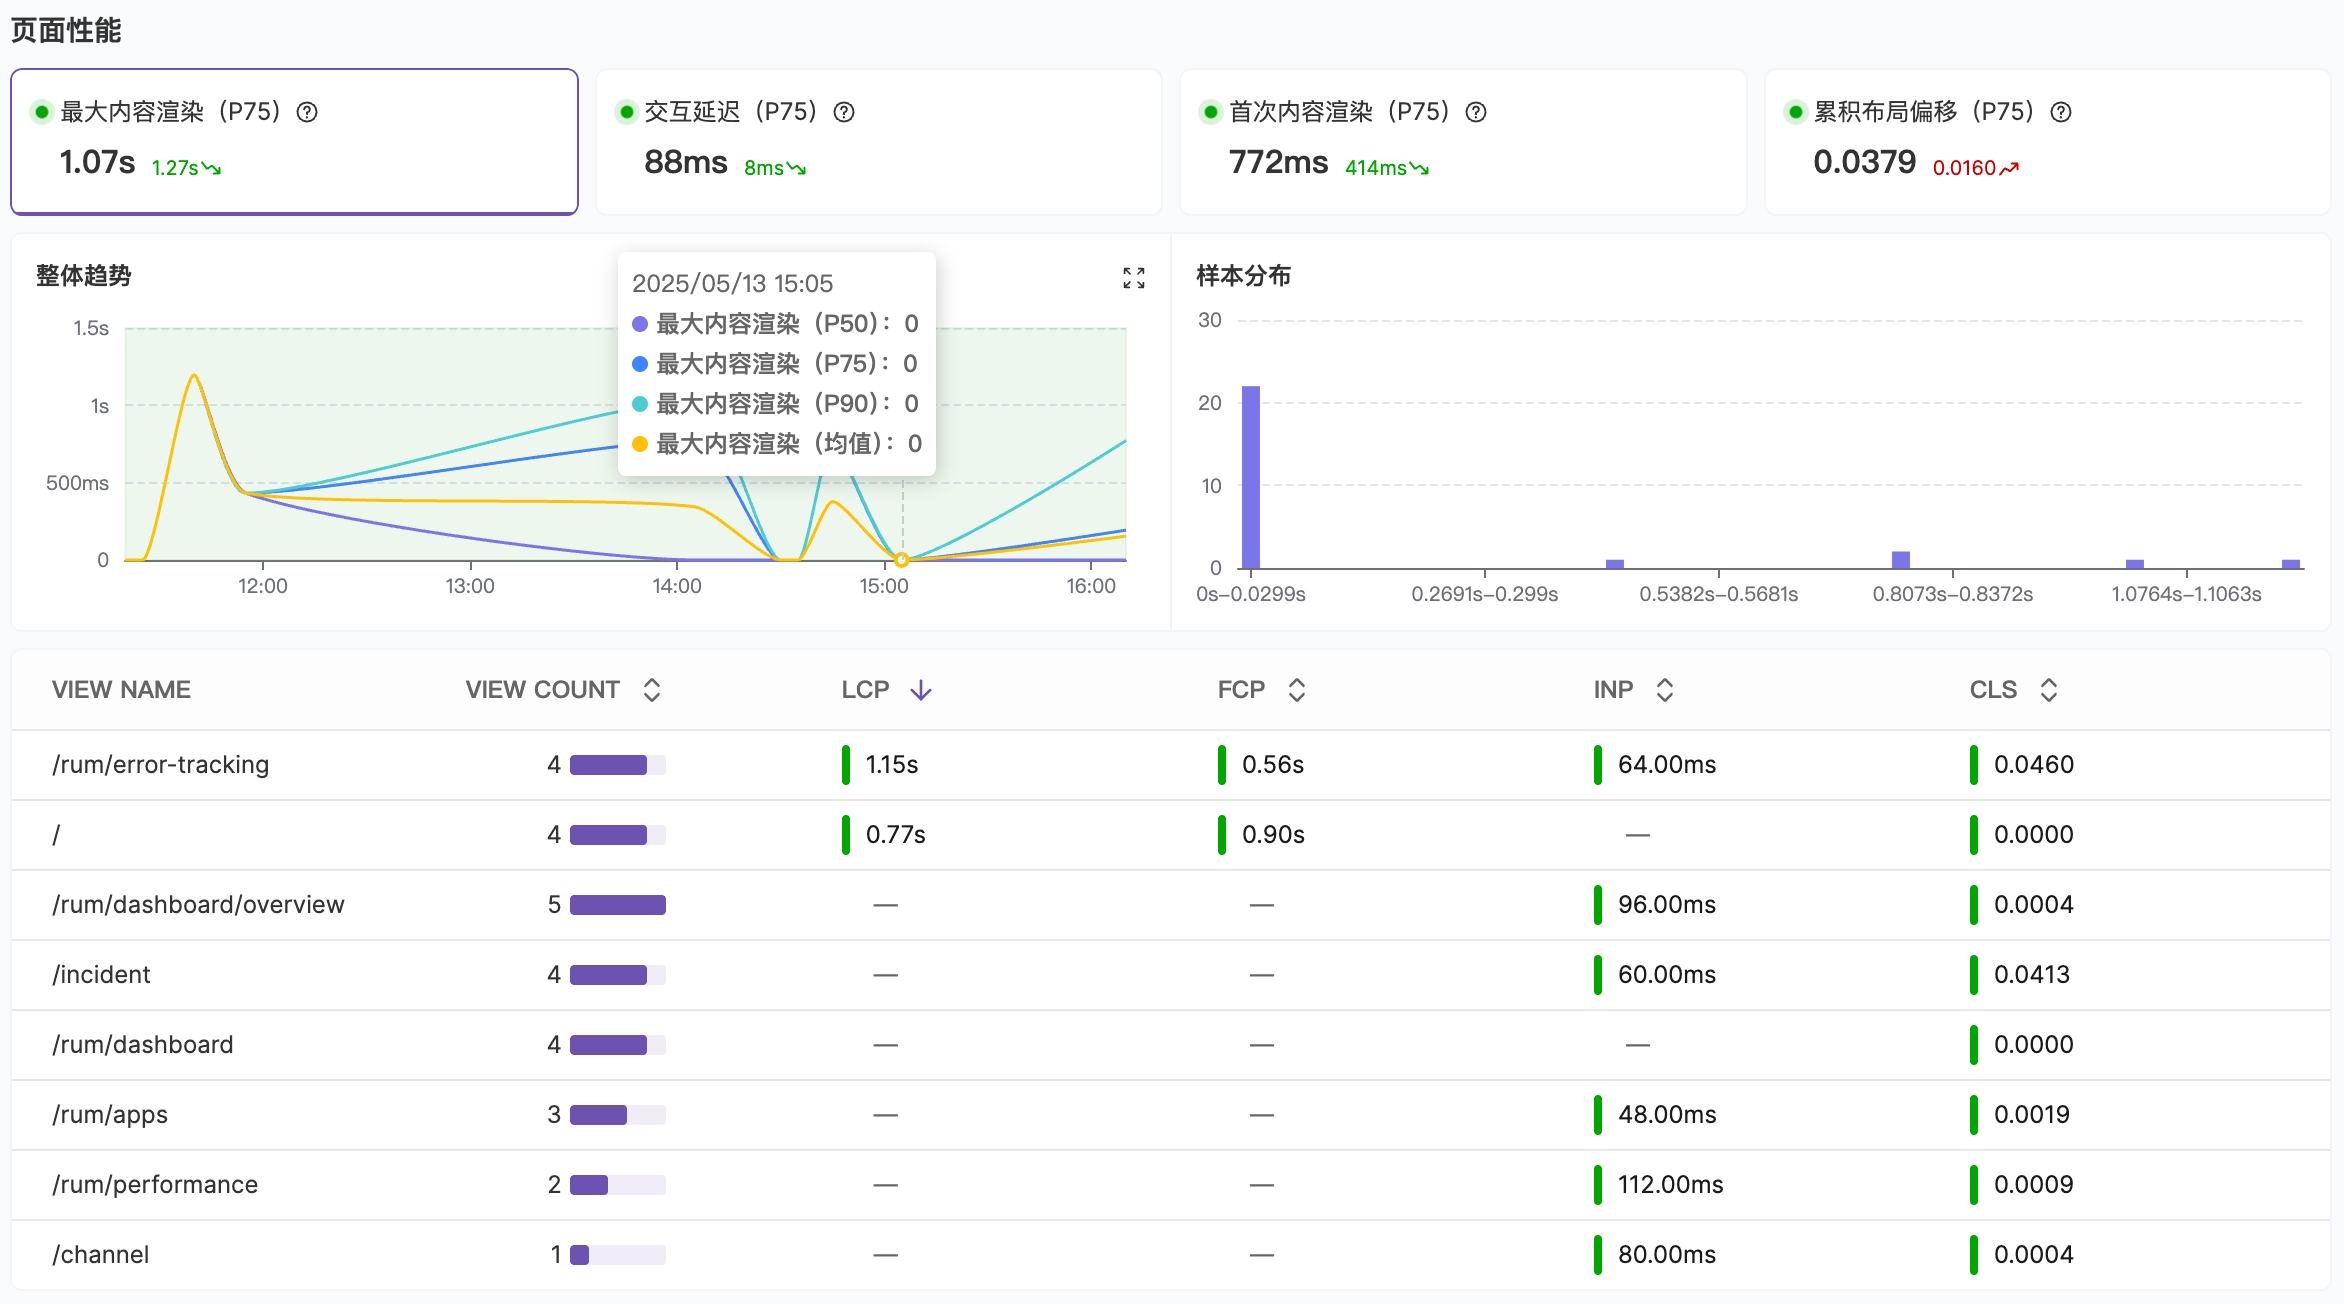
2. Performance Analysis — Comprehensive Control of Application Experience#

2025-05-14-11-56-18
The performance analysis module focuses on full-chain monitoring of application loading and interaction experience, including:
Page Performance: Monitor trends and sample distribution of core page loading metrics such as FCP, LCP, CLS, and FCP.
Long Tasks: Events that block the browser's main thread for more than 50 milliseconds.
XHR and Fetch Requests: Analyze the loading performance of XHR and Fetch interfaces to locate slow interfaces.
Static Resources: Analyze the loading time of static resources to identify performance bottlenecks during application loading.
For more information about the displayed data, see Data Collection.

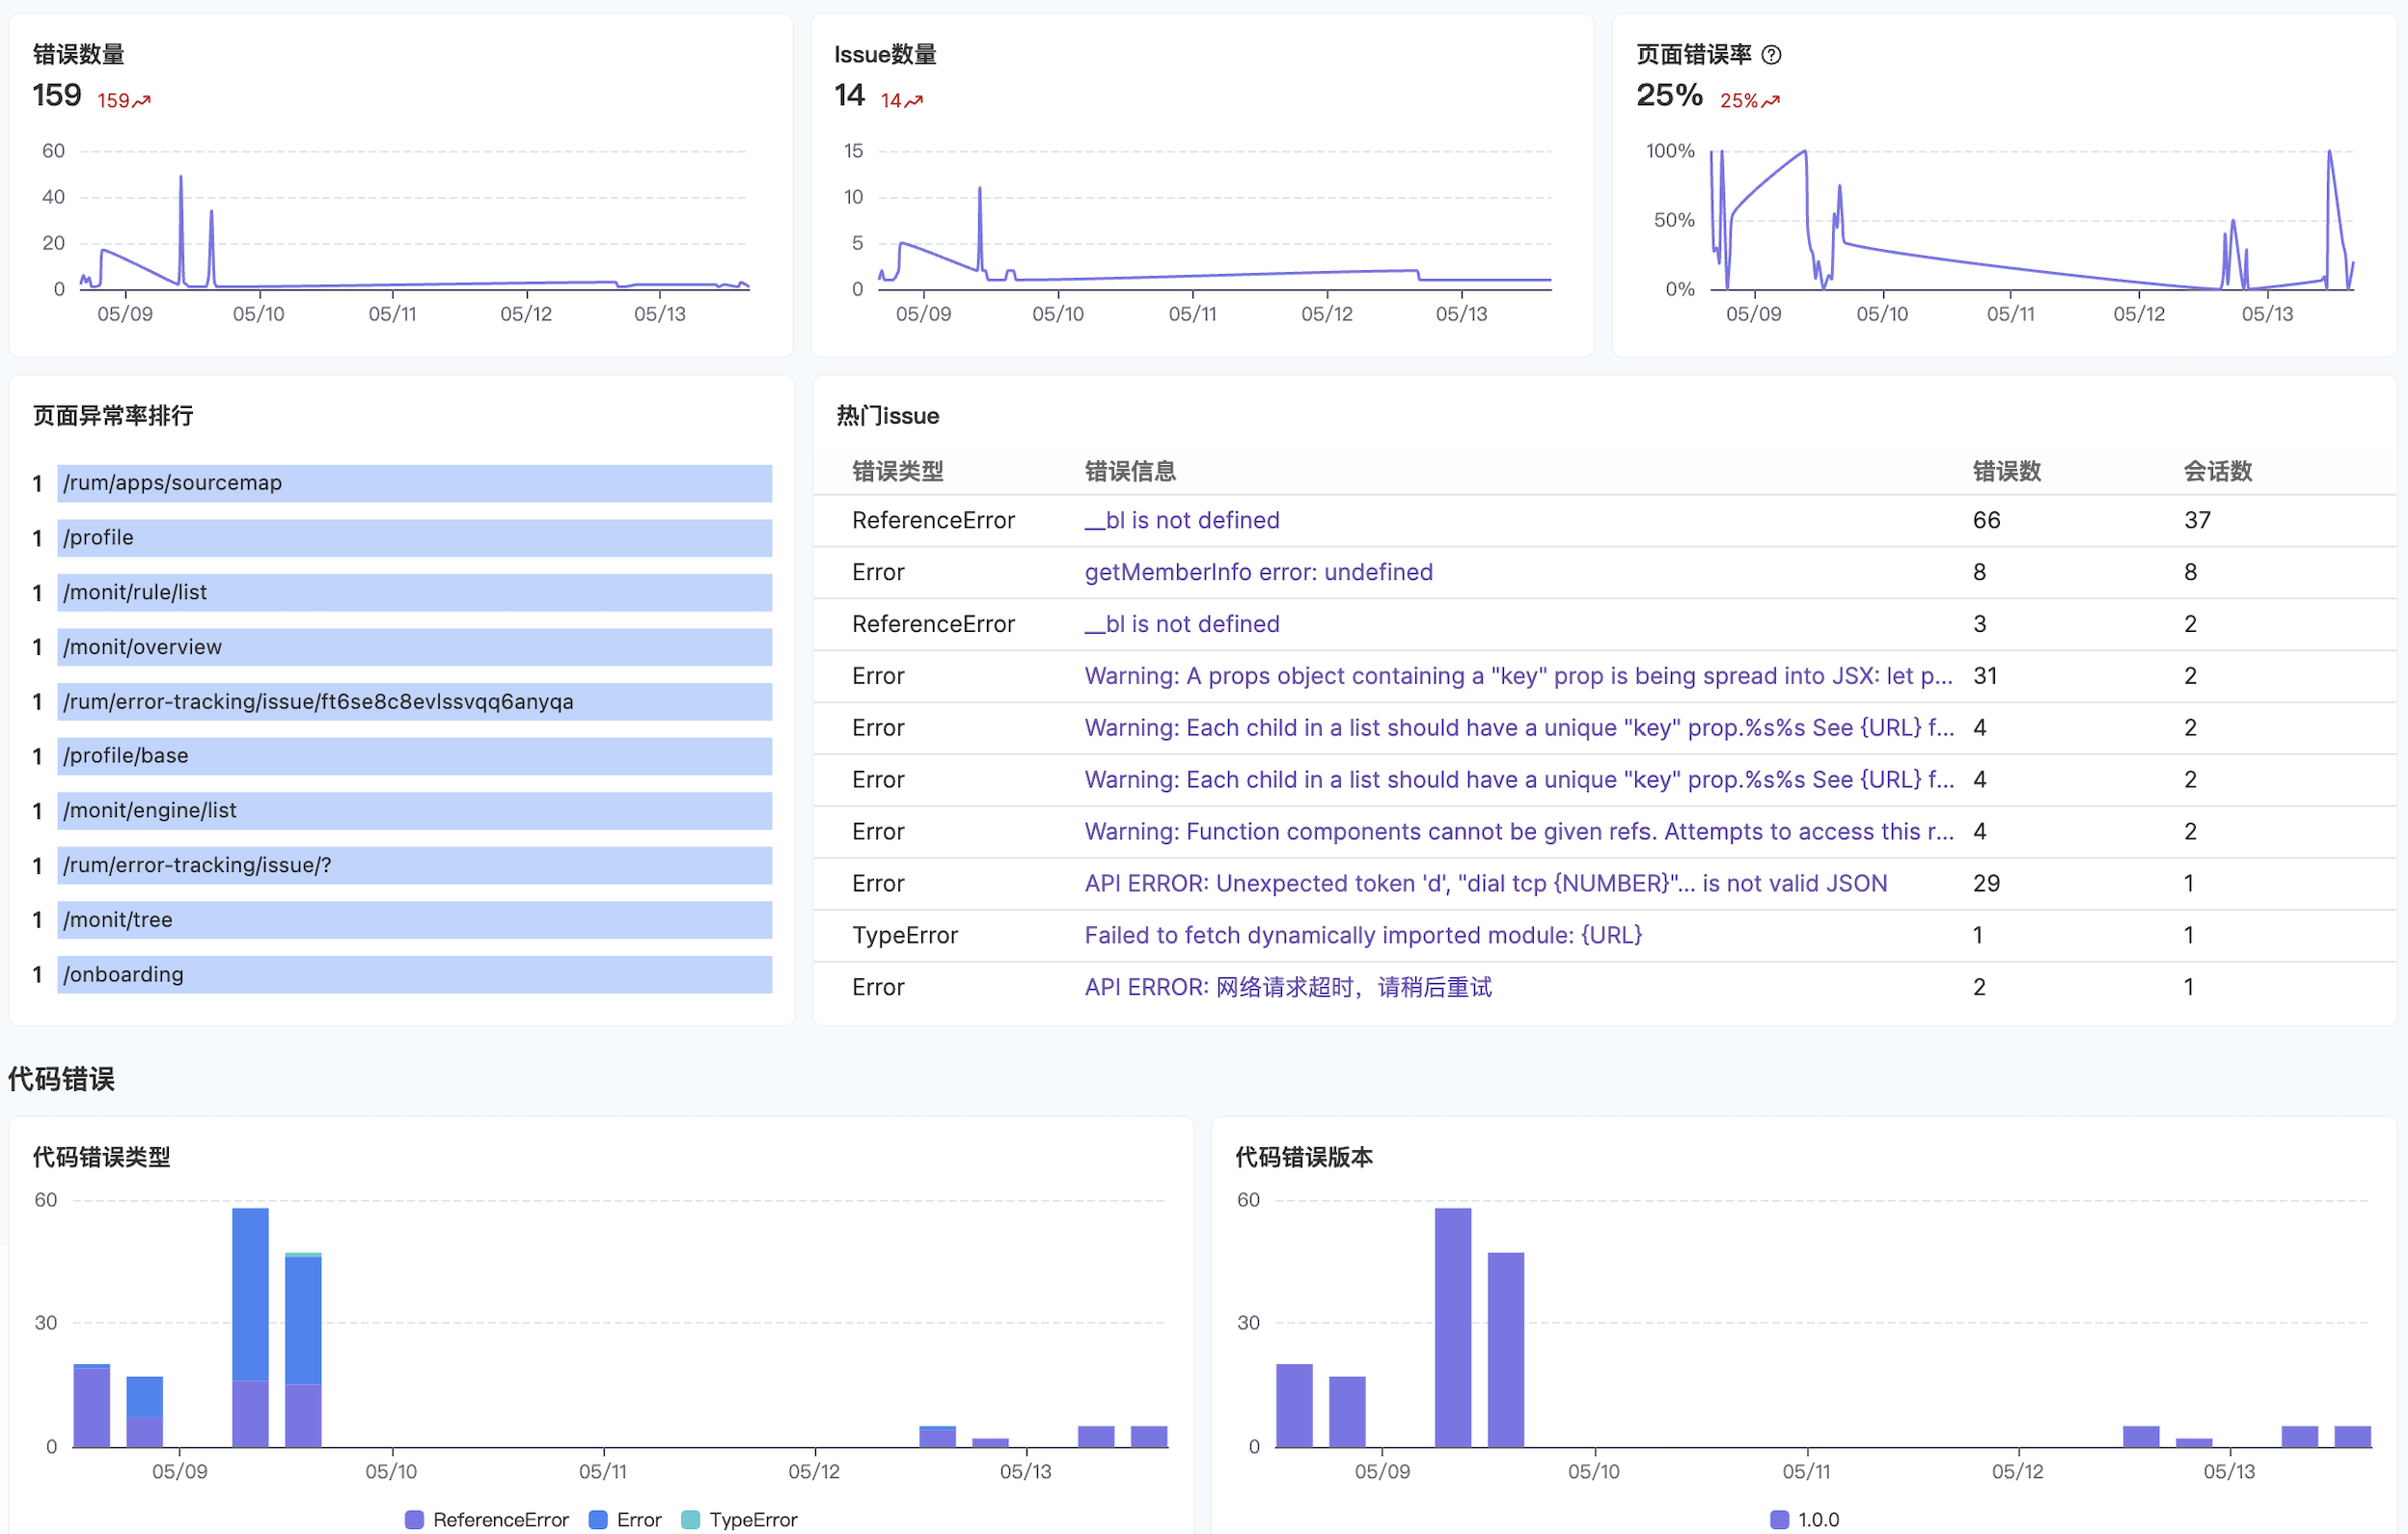
3. Error Analysis — Fast Location and Diagnosis of Errors#

2025-05-14-11-58-51
The error analysis module provides you with comprehensive error monitoring and diagnostic capabilities, including:
Page Error Rate: Pages with the most errors, helping you identify which pages need priority attention.
Top Issues: Ranking of issues affecting the most users, helping you identify problems that need priority attention. If you need to understand the issue grouping strategy, check Error Grouping.
Code Errors: Categorized display of error types. If you need to dig deeper, refer to Error Tracking to investigate critical frontend errors and understand when new errors appear.
API and Resource Errors: Monitor which APIs and static resources produce the most errors.

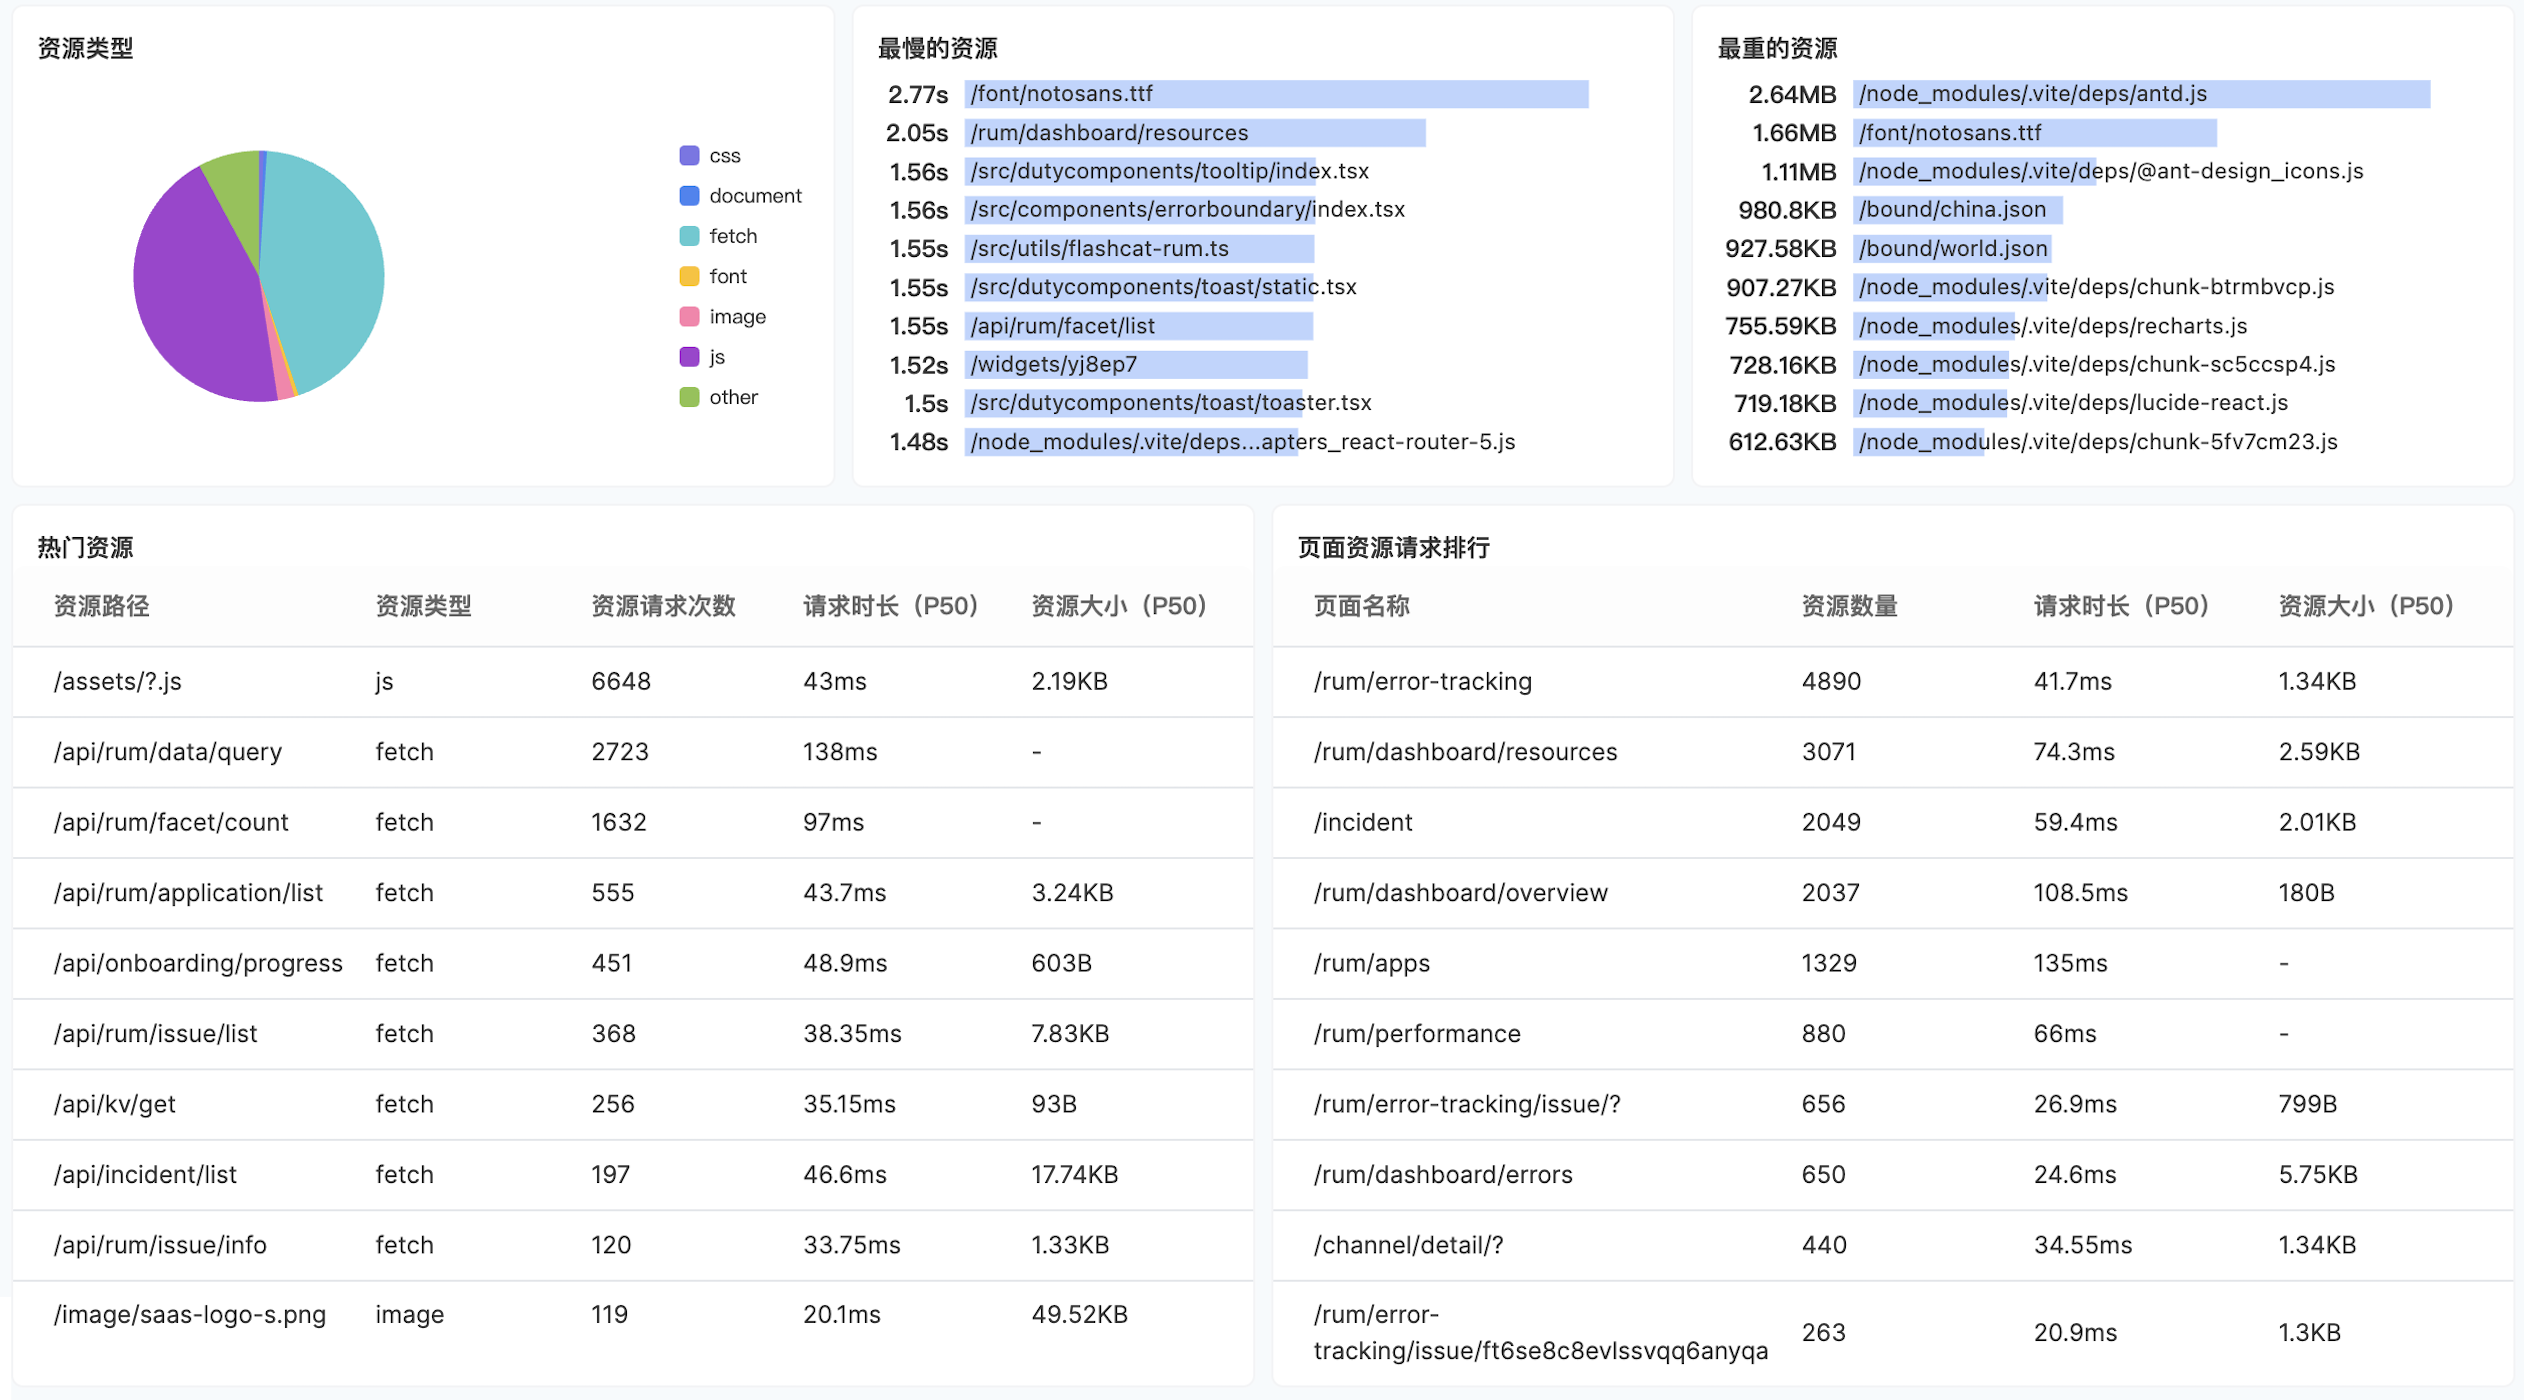
4. Resource Analysis — Fine-grained Resource Optimization#

2025-05-14-12-00-53
The resource analysis module helps you identify which resources have the greatest impact on your application:
Resource Ranking: Monitor the most loaded and heaviest resources to identify optimization priorities.
Resource Loading Timeline: Monitor resource timing trends collected by the browser SDK (DNS resolution, TCP connection, loading time, etc.).
XHR and Fetch Requests: Distinguish distribution trends of different request types, methods, and error status codes.
Third-party Resources: Resources where the resource address (host) does not match the current page address (host) are identified as third-party resources.

Frequently Asked Questions#


Why is the size or timing data for some resources 0?#

1.
Connection Reuse (Keep-Alive): When resource requests use keep-alive to maintain connections, DNS queries and TCP connection processes only occur on the first request, with subsequent requests reusing the same connection, so related data may not be recorded or may be 0.
2.
Cross-origin Resource Loading: If resources are loaded cross-origin without configuring related header information, the browser cannot collect complete performance data. This is the main reason for missing data.
3.
Browser Compatibility: In rare cases, some browsers may not support the Performance API, making it impossible to obtain resource-related performance data.

Why is the resource_status for some resources 0?#

1.
Cross-origin Resource Loading: If resources are loaded cross-origin without setting cross-origin access permissions, the browser cannot obtain resource status information.
2.
Browser Compatibility: Some browsers may not support the Performance API, preventing relevant data collection (extremely rare).

How to solve missing data for cross-origin resources?#

1.
Support collecting timing data for cross-origin resources
Add Timing-Allow-Origin to the HTTP response headers of cross-origin resources
Timing-Allow-Origin: *
For more information on CORS, see Resource Timing API in the MDN Web Docs.
2.
Support collecting status codes for cross-origin resources
Add Access-Control-Allow-Origin to the HTTP response headers of cross-origin resources
Access-Control-Allow-Origin: *
Add crossorigin="anonymous" to the HTML tag referencing the resource, such as:
For detailed information, see Access-Control-Allow-Origin header and crossorigin attribute in the MDN Web Docs.

How to collect user information#

1.
Logged-in User Identification: For applications requiring user login (such as SaaS products, membership systems, e-commerce platforms, etc.), you can refer to User Identification Collection
2.
Device Fingerprint Identification: For applications without login state (such as corporate websites, marketing pages, public content platforms, etc.), it is recommended to generate stable fingerprints based on browser characteristics, device information, and other multi-dimensional data and report user identifiers

添加官方技术支持微信

在这里,获得使用上的任何帮助,快速上手FlashDuty

微信扫码交流
上一页
Advanced Configuration
下一页
Overview
Built with