
VictoriaLogs
1. Prerequisites
1.1 How it works
/select/logsql/query endpoint. The returned data can be viewed as a two-dimensional table. In threshold mode, "label fields" and "value fields" need to be mapped./select/logsql/stats_query endpoint. The returned data follows the Prometheus protocol format. Monitors automatically identifies which fields are labels and which are values, requiring no additional configuration.1.2 Raw query
error | fields _time, _stream, _msg | sort by (_time) desc1.3 Statistics
stats keyword must be used. Relevant configuration items are:_time:1d | stats by (level) count(*) total_time filter condition, such as _time:5m, to limit the query time range. Otherwise, it queries all data, which may cause performance issues.2. Threshold mode
2.1 Raw query example
level:ERROR | stats by (level) count(*) total| level | total |
|---|---|
| ERROR | 150 |
total and the label field as level (or leave unconfigured, and Monitors will automatically identify). Example configuration for different thresholds and levels:$A.total >= 50 or simply $A >= 50 (since there's only one value field: total)$A.total >= 100 or simply $A >= 100 (since there's only one value field: total)2.2 Statistics example
_time:1d and level:ERROR | stats by (level) count(*) totaltotal{level="ERROR"} 150$A.total >= 50 or simply $A >= 50 (since there's only one metric field: total)$A.total >= 100 or simply $A >= 100 (since there's only one metric field: total)2.3 Recovery logic
$A.total < 10, to only consider recovery when the error count drops below 10, reducing flapping.${label_name}), which are automatically replaced with the corresponding label values from the alert event, allowing the recovery query to detect specific alert objects.3. Data exists mode
_time:15m and level:ERROR | stats by (level) count(*) total | filter total:>10| filter total:>10 is used to filter data where total is greater than 10. As long as any data row meets this condition, Monitors will trigger an alert. If at some point no data row meets this condition, the alert is considered recovered.4. No data mode
4.1 Configuration example
_time:15m and level:INFO | stats by (level) count(*) total5. Get original logs when alerting
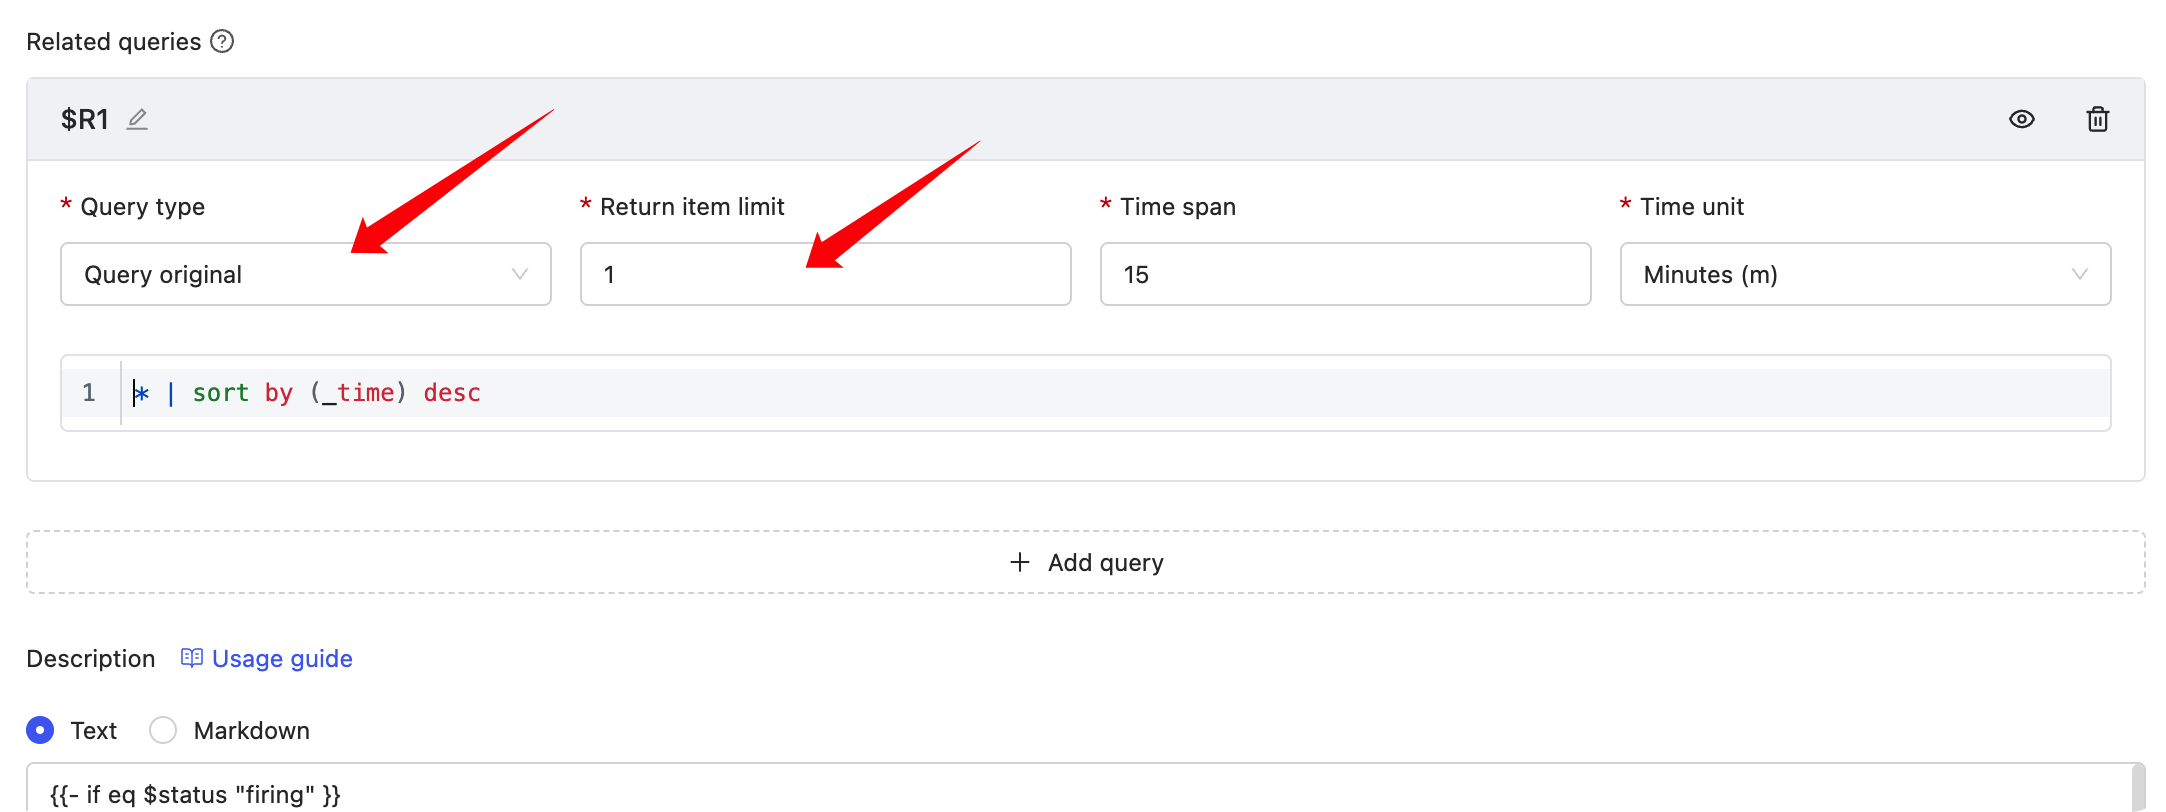
{{- if eq $status "firing" }}
triggered value: {{ $value | printf "%.3f" }}
{{- range $x := $relates.R1}}
{{- range $k, $v := $x.Fields }}
{{- if eq $k "_time" }}
{{ $k }} : {{ timeFormat $v "2006-01-02T15:04:05Z07:00" 8 }}
{{- else }}
{{ $k }} : {{ $v }}
{{- end }}
{{- end }}
{{- end}}
{{- else}}
Recovered
{{- end}}

 微信扫码交流
修改于 2026-01-09 03:05:07