Flashduty Docs
中文English
RoadmapAPI官网控制台
中文English
RoadmapAPI官网控制台
  1. Analysis Dashboard
  • Introduction
  • On-call
    • Getting Started
      • Quick start
      • FAQ
      • Product Comparison
    • Incidents
      • What is an Incident
      • View Incidents
      • Handle Incidents
      • Escalations and Assignments
      • Custom Fields
      • Custom Actions
      • Alert Noise Reduction
      • Past Incidents
      • Outlier Incidents
      • Status Pages
    • Configure On-call
      • Channels
      • Integrate Alerts
      • Alert Noise Reduction
      • Escalation Rules
      • Label Enrichment
      • Schedules
      • Templates
      • Service Calendars
      • Preferences
      • Alert Routing
      • Silence and Inhibition
      • Filters
      • Notifications
      • Alert Pipeline
    • Advanced Features
      • Referencing Variables
      • Dynamic Assignment
      • Insights
      • War-room
    • Integrations
      • Alerts integration
        • Standard Alert Integration
        • Email Integration
        • Nightingale/FlashCat Integration
        • Prometheus Integration
        • Grafana Integration
        • Zabbix Integration
        • Uptime Kuma Integration
        • Alibaba Cloud ARMS Integration
        • Alibaba Cloud Monitor CM Event Integration
        • Alibaba Cloud Monitor CM Metrics Integration
        • Alibaba Cloud SLS Integration
        • AWS CloudWatch Integration
        • Azure Monitor Integration
        • Baidu Cloud BCM Integration
        • Huawei Cloud CES Integration
        • Influxdata Integration
        • Open Falcon Integration
        • PagerDuty Integration
        • Tencent BlueKing Integration
        • Tencent Cloud CLS Integration
        • Tencent Cloud Monitor CM Integration
        • Tencent Cloud EventBridge
        • OceanBase Integration
        • Graylog Integration
        • Skywalking Integration
        • Sentry Integration
        • Jiankongbao Integration
        • AWS EventBridge Integration
        • Dynatrace Integration
        • Huawei Cloud LTS Integration
        • GCP Integration
        • Splunk Alert Events Integration
        • AppDynamics Alert Integration
        • SolarWinds Alert Events Integration
        • Volcengine CM Alert Events Integration
        • Volcengine CM Event Center Integration
        • Volcengine TLS Integration
        • OpManager Integration
        • Meraki Integration
        • Keep Integration
        • ElastAlert2 Alert Integration
        • StateCloud Alert Events
        • Guance Alert Events
        • Zilliz Alert Events
        • Huawei Cloud APM Alerts
        • zstack integration
        • Monit Alert Integration
        • RUM Alert Integration
      • Change integration
        • Standard Change Event
        • Jira Issue Events
      • IM integration
        • Feishu (Lark) Integration Guide
        • Dingtalk Integration
        • WeCom Integration
        • Slack Integration
        • Microsoft Teams Integration
      • Single Sign-On
        • Authing Integration
        • Keycloak Guide
        • OpenLDAP Guide
      • Webhooks
        • Alert webhook
        • Incident webhook
        • Costom action
        • ServiceNow Sync
        • Jira Sync
      • Other
        • Link Integration
  • RUM
    • Getting Started
      • Application Management
      • Introduction
      • Quick Start
    • SDK Integration
      • Android
        • Data Collection
        • SDK Integration
        • Advanced Configuration
        • Compatibility
      • iOS
        • Data Collection
        • Compatibility
        • SDK Integration
        • Advanced Configuration
      • Web
        • Data Collection
        • SDK Integration
        • FAQ
        • Advanced Configuration
        • Compatibility
    • Session Explorer
      • Overview
      • Data Query
    • Analysis Dashboard
      • Web
      • Native
    • Performance Monitoring
      • Metrics
      • Performance Optimize
      • Overview
      • Performance Analysis
    • Error Tracking
      • Issues
      • Error Grouping
      • Source Mapping
      • Overview
      • Issue Status
      • Issue Alerting
      • Error Reporting
        • iOS
        • Android
        • Web
    • Best Practice
      • Distributed Tracing
    • Session Replay
      • View Session Replay
      • SDK Configuration
      • Overview
      • Privacy Protection
    • Others
      • Data Collection
      • Terminology
      • Data Security
  • Monitors
    • Getting Started
      • Introduction
      • Quick Start
    • Alert Rules
      • Prometheus
      • ElasticSearch
      • Loki
      • ClickHouse
      • MySQL
      • Oracle
      • PostgreSQL
      • Aliyun SLS
      • VictoriaLogs
    • FAQ
      • FAQ
  • Platform
    • Teams and Members
    • Permissions
    • Single Sign-On
  • Terms
    • Terms of Service
    • User Agreement/Privary Policy
    • SLA
    • Data Security
中文English
RoadmapAPI官网控制台
中文English
RoadmapAPI官网控制台
  1. Analysis Dashboard

Native

Overview#


Flashduty Native RUM analysis dashboard provides out-of-the-box visualization dashboards that automatically collect and analyze multi-dimensional data including user sessions, application performance, crash exceptions, network requests, and more, helping you fully understand your mobile application's real-world performance, quickly locate performance bottlenecks and abnormal issues, and continuously optimize user experience.
The analysis dashboard primarily includes 4 analytical dimensions: Overview, Performance Analysis, Error Analysis, and Resource Analysis.

1. Overview — Key Metrics at a Glance#

2026-01-13-11-46-18
The overview module focuses on the core metrics of mobile applications across multiple dimensions, including:
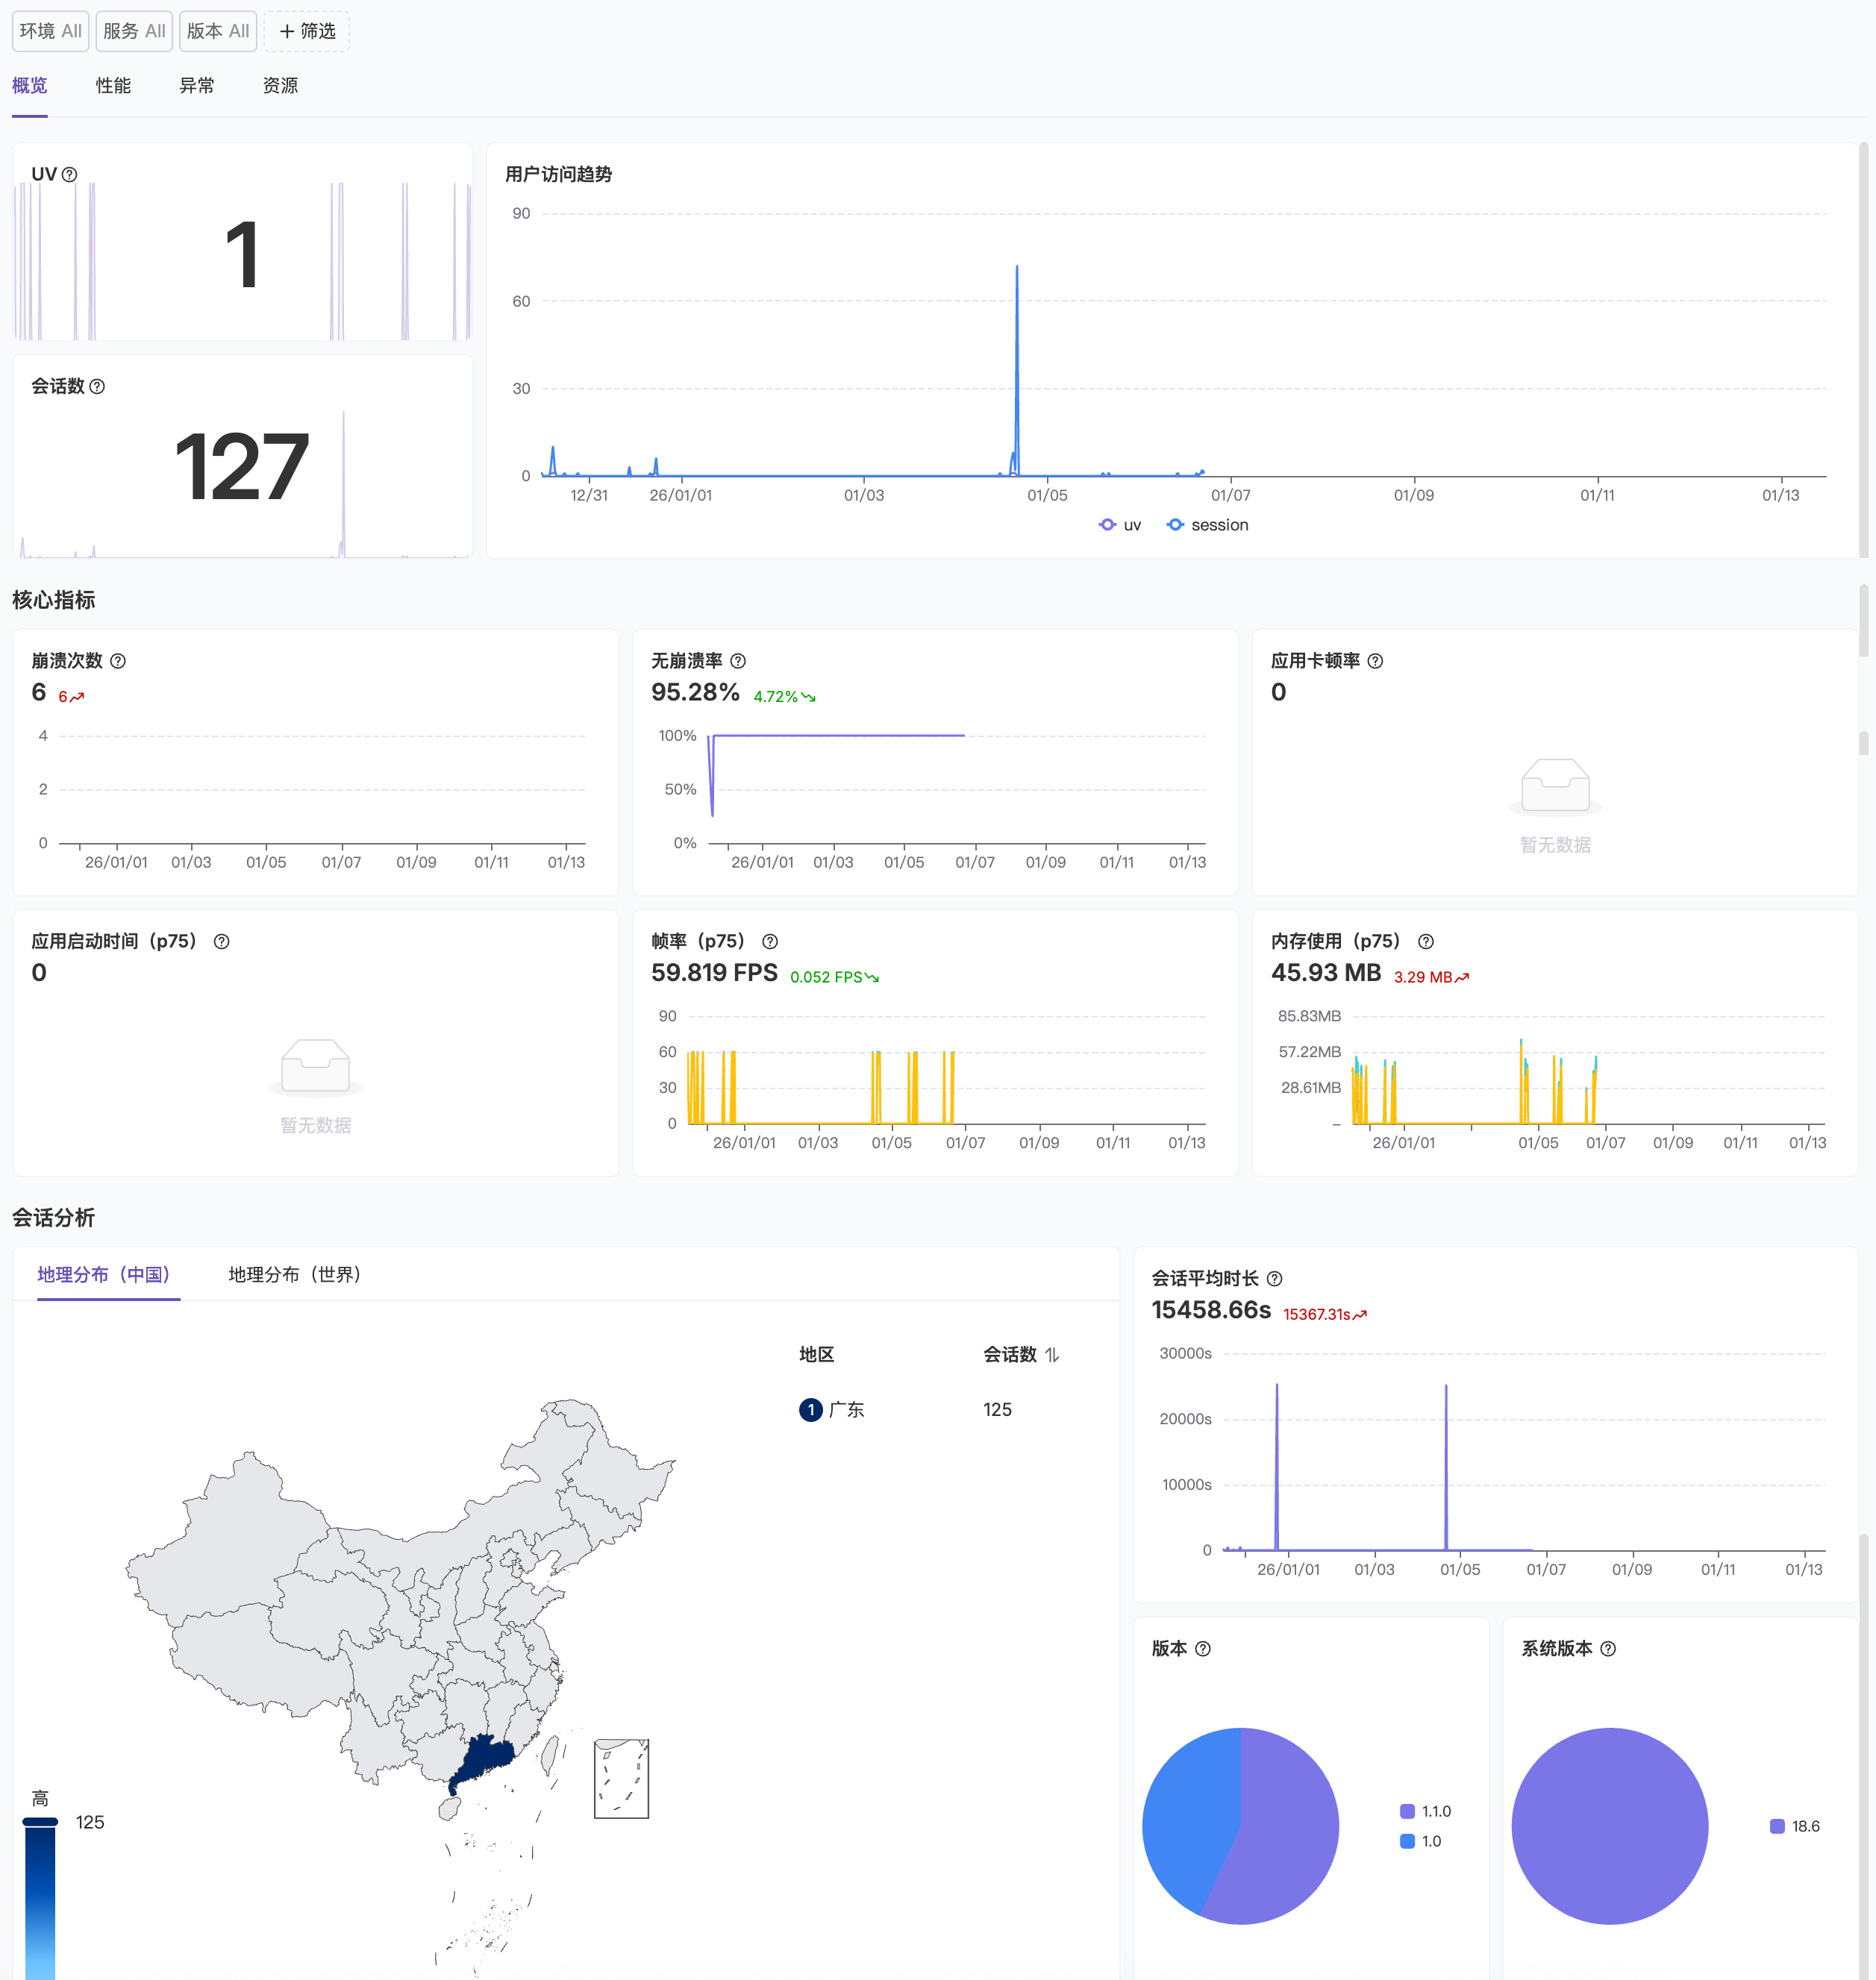
Traffic Metrics: Monitor UV (unique visitors) and session count to help you grasp overall user activity trends.
Core Health Metrics: Highlight three mobile application core metrics: crash count, crash-free rate, and app freeze rate, quickly identifying application stability issues.
User Activity Trends: Track UV and Session change trends through time-series charts to understand user activity patterns.
User Distribution: Analyze user sources based on geographic location to understand regional user activity.
Session Analysis: Track distribution trends of average session duration to evaluate user stickiness and usage depth.
Version Distribution: Monitor user distribution across different system versions (Android/iOS) and application versions to support compatibility optimization and version iteration.

2. Performance Analysis — Comprehensive Control of Application Experience#

2026-01-13-11-47-14
The performance analysis module focuses on full-chain monitoring of application startup, page rendering, interaction smoothness, and other core experience metrics, including:

Core Performance Metrics#

The top displays P75 values of four key performance metrics:
Application Startup Time (P75): Monitors the P75 percentile of app startup time to evaluate startup performance. Startup time directly impacts user first impressions and willingness to use.
Frame Rate (P75): Shows the P75 percentile of app runtime frame rate to measure screen smoothness. Target is 60fps; higher values indicate smoother interactions.
CPU Consumption (P75): Tracks the P75 percentile of CPU usage to identify compute-intensive operations. Excessive CPU consumption leads to device heating and increased power drain.
Memory Usage (P75): Monitors the P75 percentile of app memory usage to detect memory leaks or abnormal growth in time.

App Startup Time Analysis#

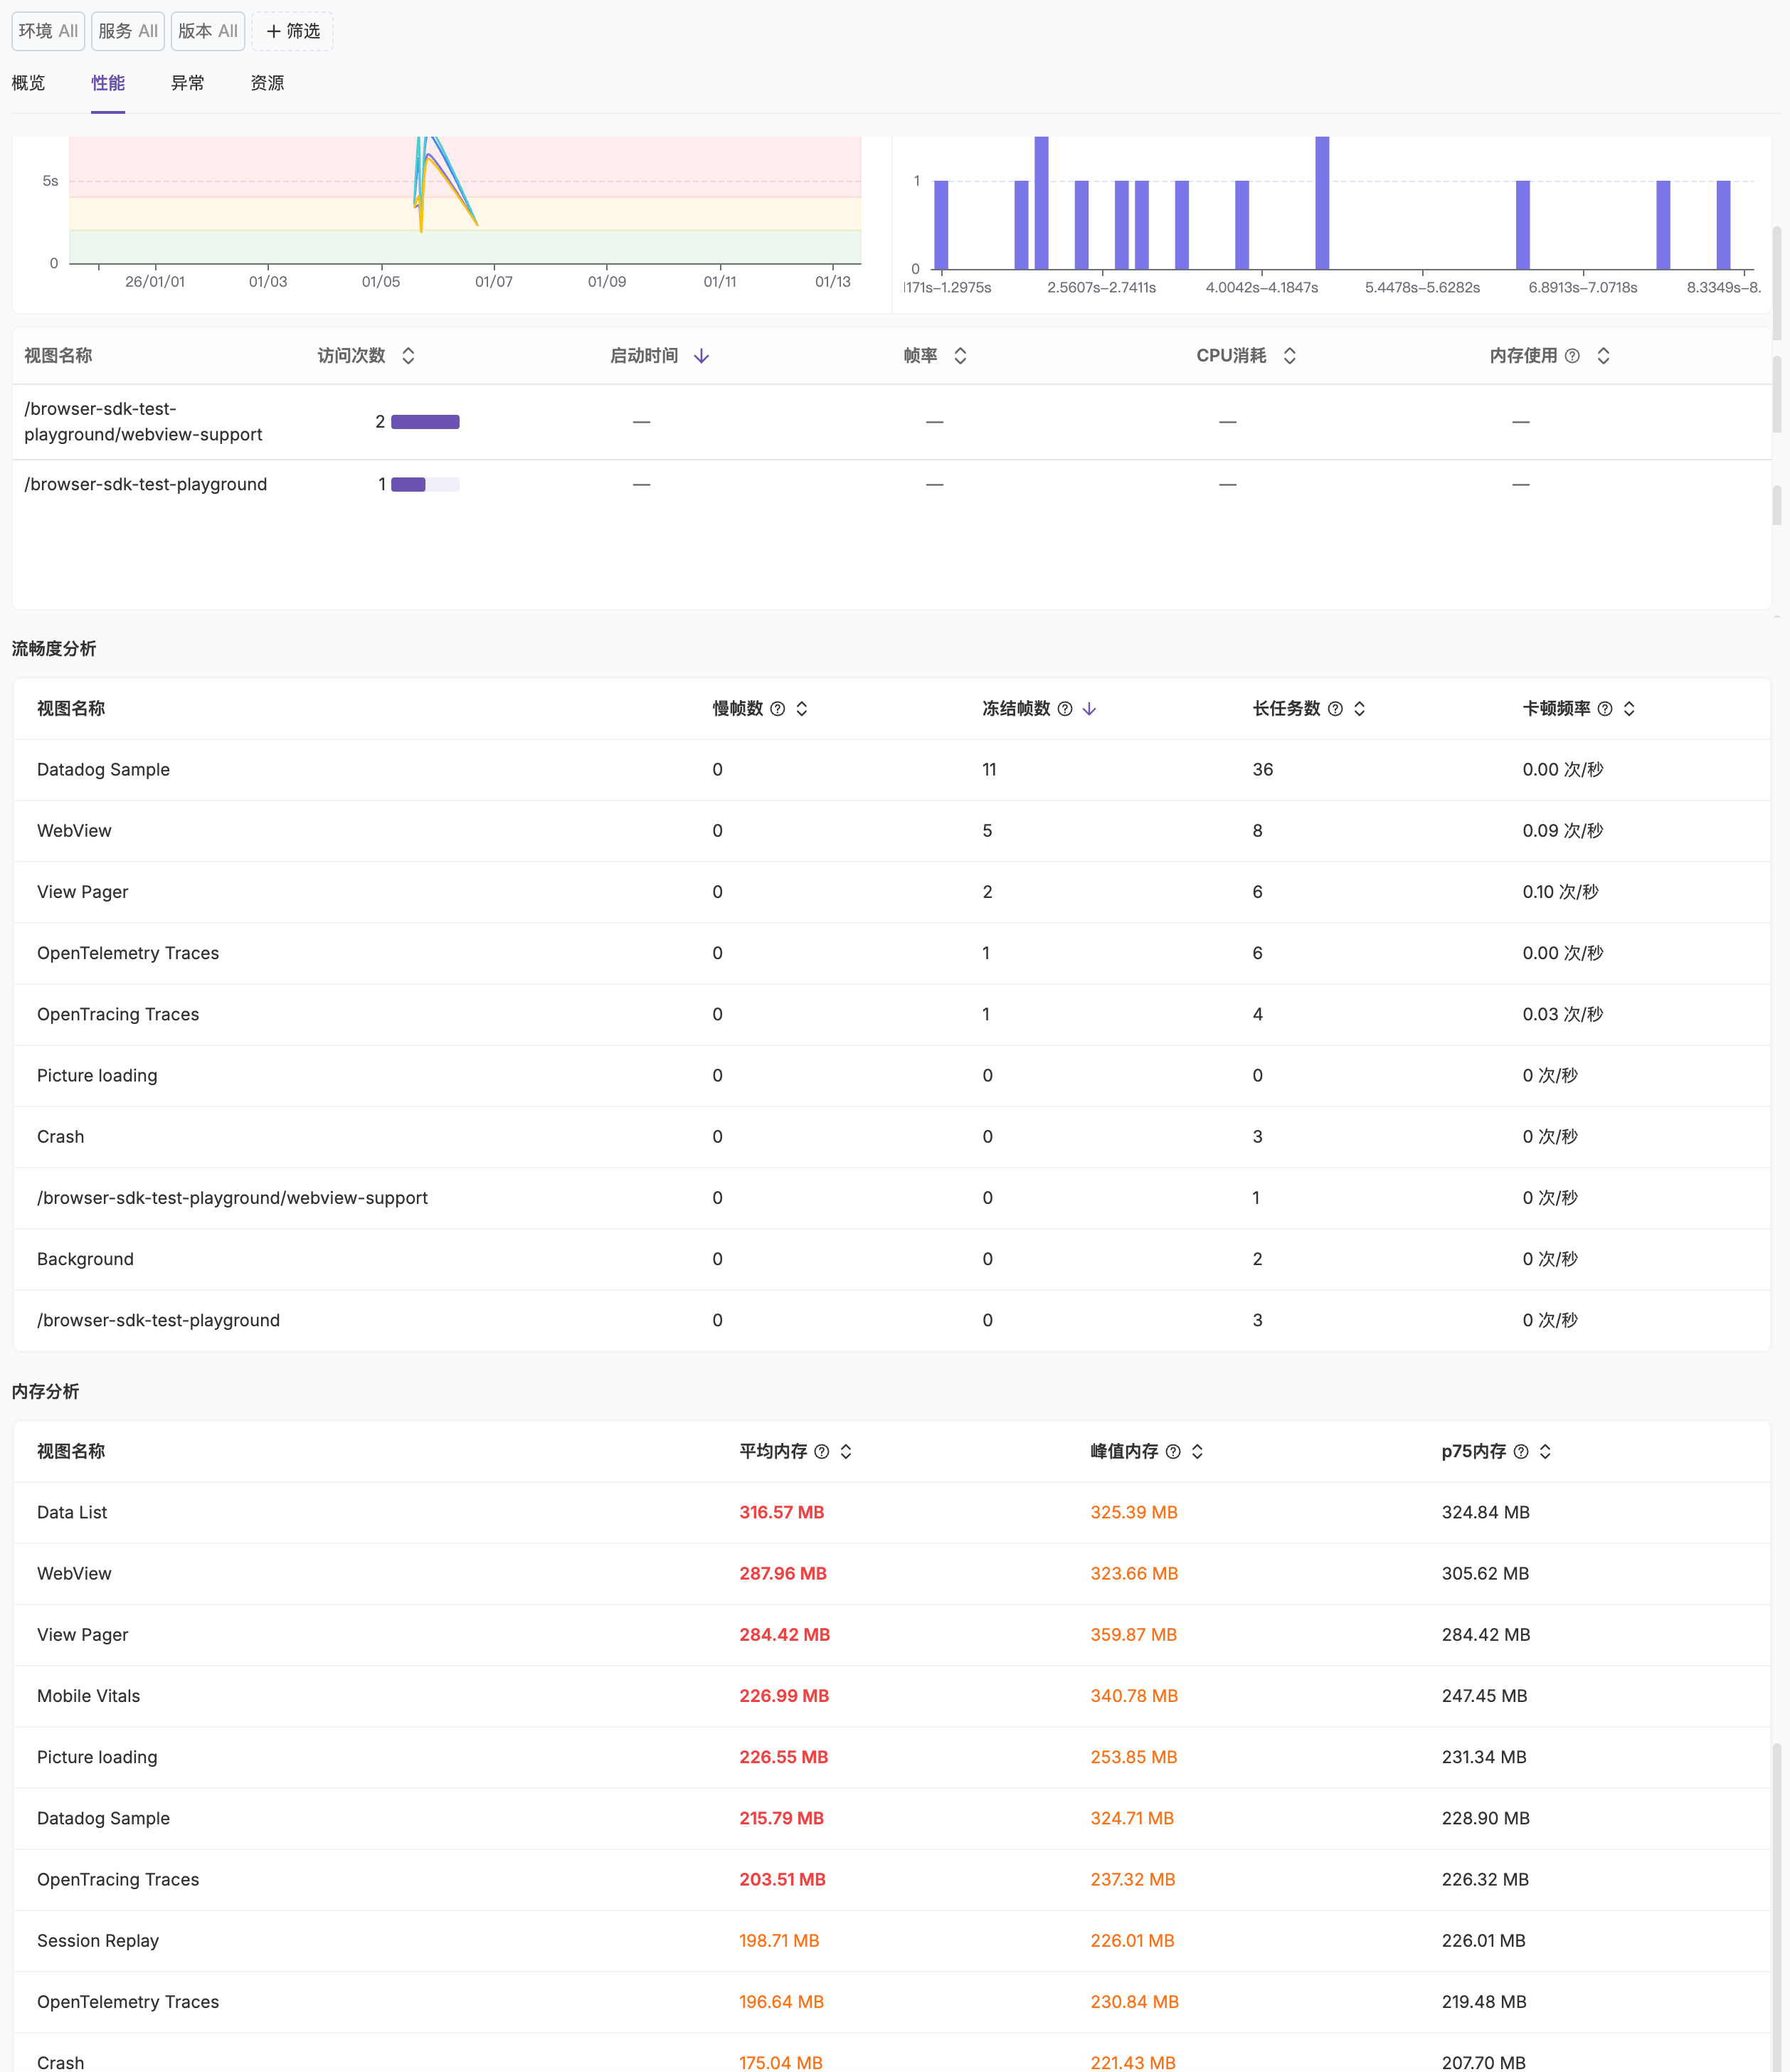
Startup Time Trend Chart: Shows app startup time trends over time to help you evaluate startup optimization effectiveness and detect performance regression in time.
Sample Distribution Histogram: Counts startup time distribution by time intervals (e.g., 0.9425s-0.9642s, 1.1162s-1.1379s), understanding real user startup experience distribution characteristics and identifying long-tail performance issues.

View Performance Details#

Counts various performance metrics by view name (page/Activity/ViewController):
Visit Count: Shows visit volume for each view, identifying core high-frequency pages.
Startup Time: Monitors loading time for each view, locating slow-loading pages.
Frame Rate: Tracks frame rate performance of each view during runtime, identifying rendering performance issues.
CPU Consumption: Counts CPU usage for each view, optimizing compute-intensive pages.
Memory Usage: Monitors memory usage for each view, discovering memory leak risks.

Smoothness Analysis#

Counts app smoothness-related metrics by view name:
Slow Frames: Counts frames with rendering time exceeding threshold (typically 16.67ms, below 60fps), identifying stutter issues. Slow frames cause users to perceive obvious interface unsmoothness.
Frozen Frames: Records completely frozen interface frames (typically exceeding 700ms), these are serious performance issues significantly affecting user experience.
Long Tasks: Tracks the number of long-running tasks on the main thread (typically threshold of 100ms or longer), locating performance bottlenecks. Long tasks block user interaction and interface updates.
Freeze Frequency: Counts app freeze occurrence frequency (times/second), evaluating overall smoothness performance.

Memory Analysis#

Counts memory usage details by view name:
Average Memory: Shows average memory usage for each view, understanding regular memory consumption levels.
Peak Memory: Records memory usage peaks during view runtime, identifying memory pressure peaks to prevent system termination due to insufficient memory (OOM).
P75 Memory: Shows P75 percentile of memory usage, reflecting memory usage for most users, more representative of real experience than average values.
For detailed performance metric descriptions, see Android Data Collection and iOS Data Collection.

3. Error Analysis — Fast Location and Diagnosis of Errors#

2026-01-13-11-48-16
The error analysis module provides you with comprehensive error monitoring and diagnostic capabilities, including:

Core Stability Metrics#

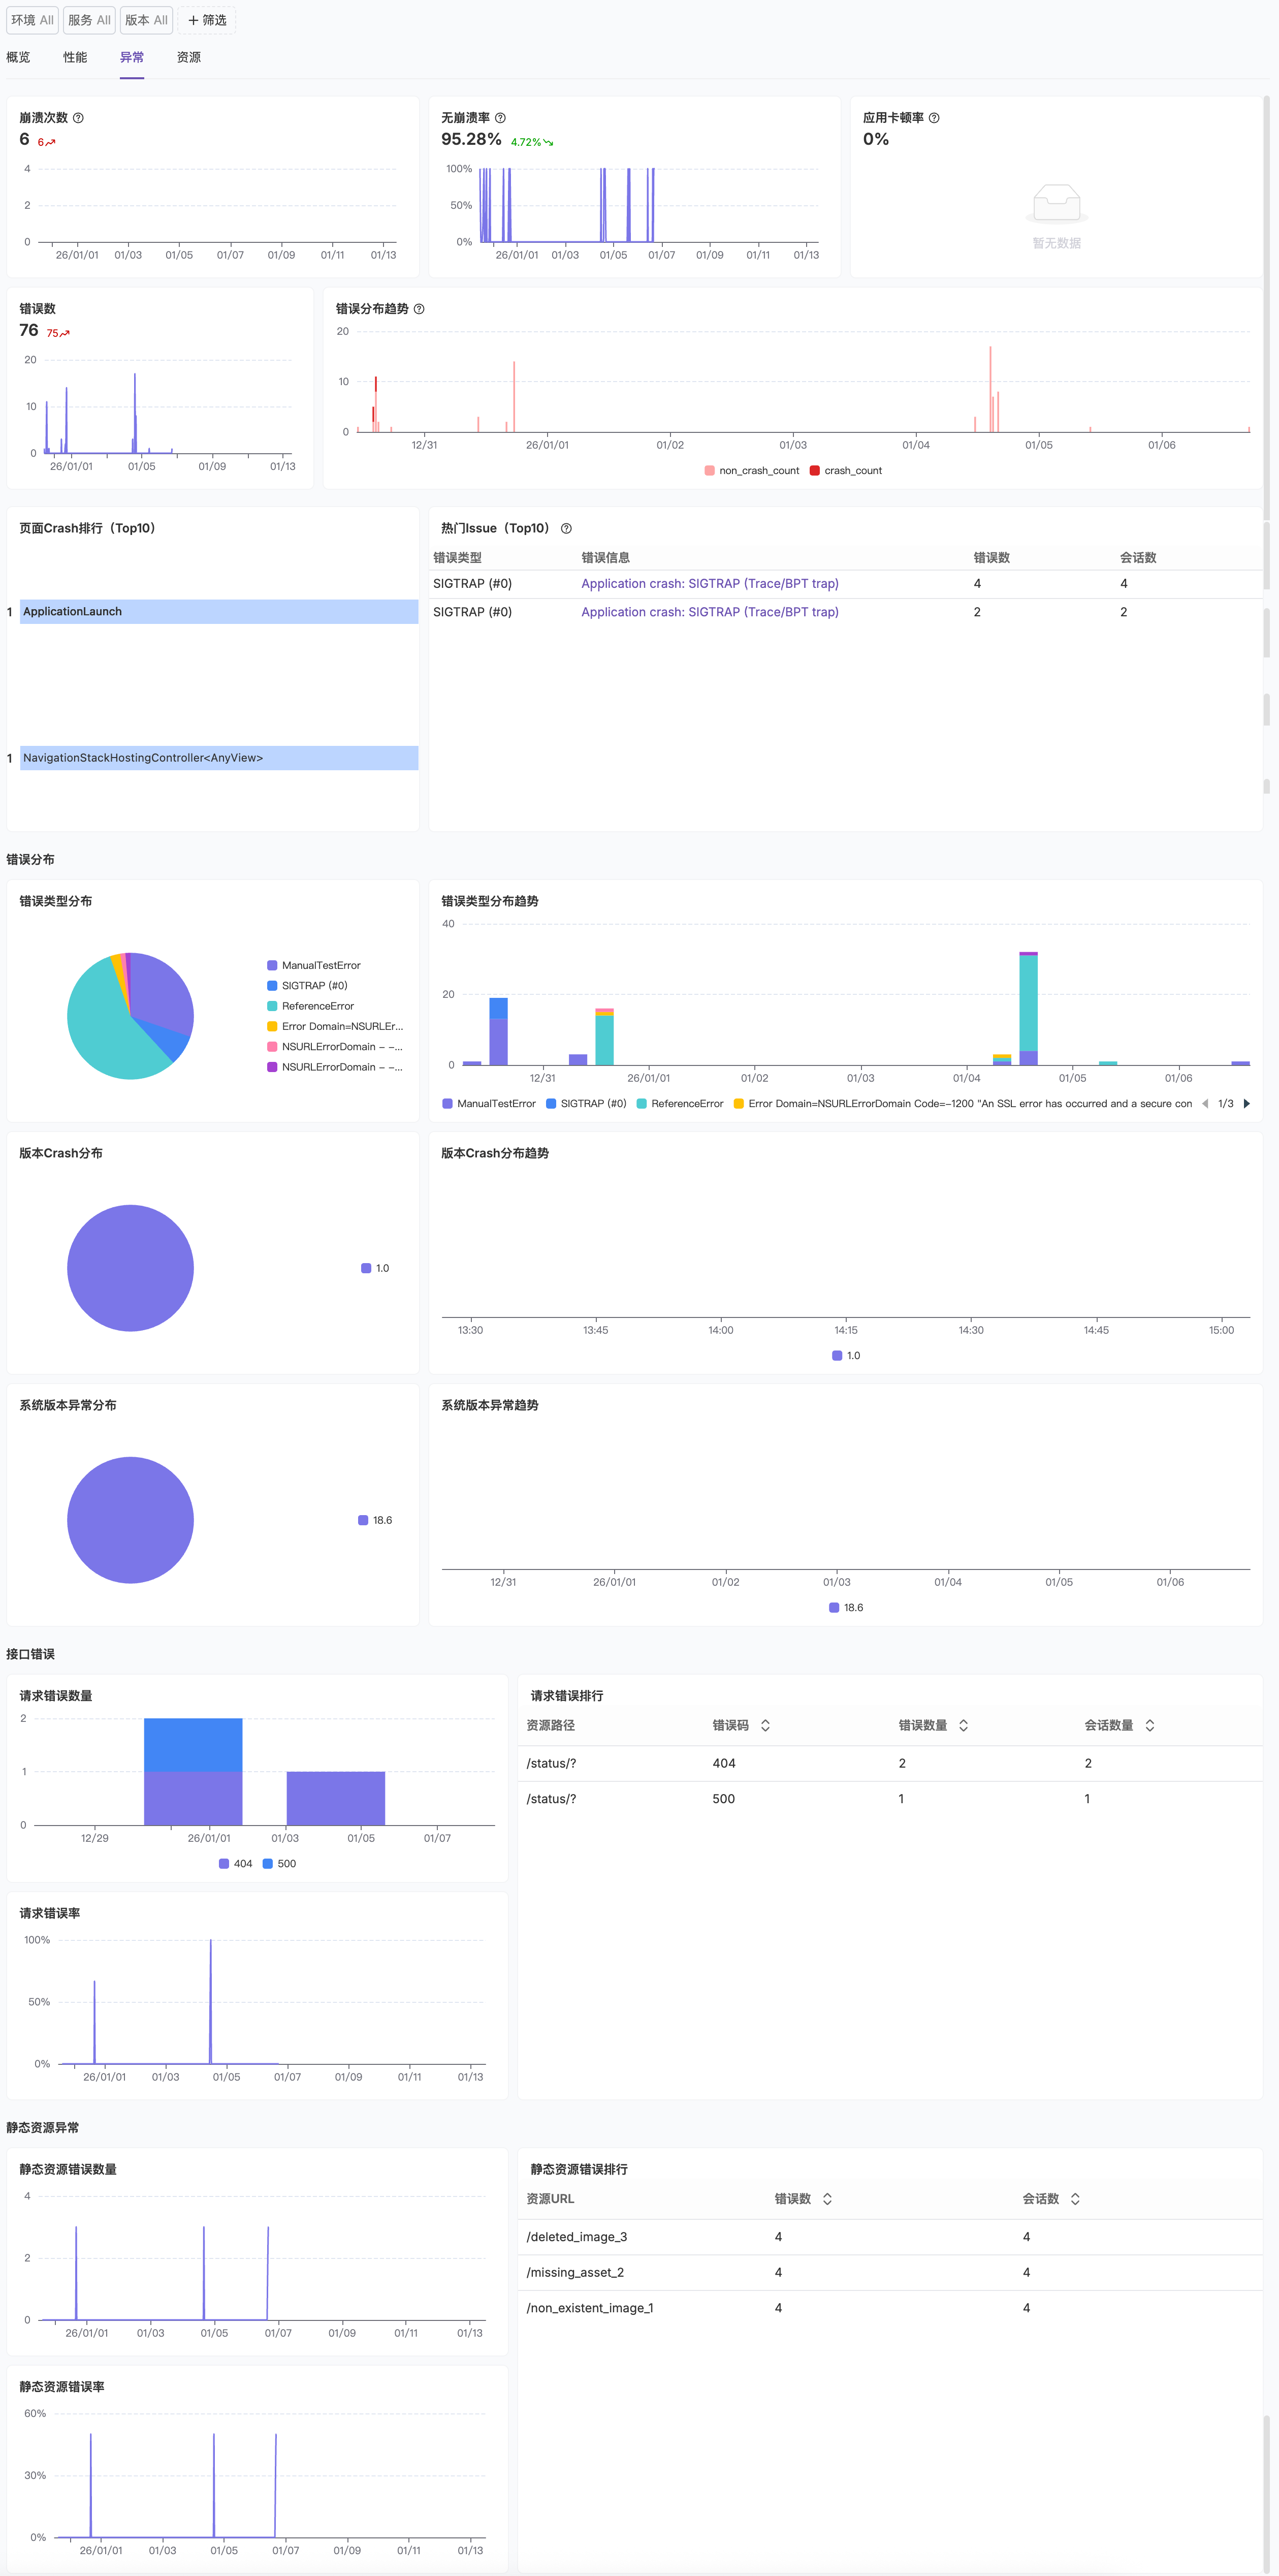
Crash Count: Monitors total app crash occurrences and trends, detecting abnormal peaks in time. Crashes force apps to exit, seriously affecting user experience.
Crash-free Rate: Tracks the proportion of crash-free sessions, evaluating overall app stability performance. Industry standards recommend maintaining crash-free rate above 99.5%.
ANR Rate: Counts Android Application Not Responding occurrence proportion. ANR indicates app main thread blocked for more than 5 seconds, users see "Application Not Responding" dialog.
App Freeze Rate: Monitors the proportion of sessions with freezes out of total sessions, evaluating the impact scope of app smoothness issues. Freezes typically refer to interface freezing, delayed response, or frame rate drops due to main thread blocking for extended periods, affecting user interaction experience.

Error Data Statistics#

Error Count: Shows total error count and time-series trends, understanding overall health status changes.
Error Type Distribution Trend Chart: Shows distribution changes of crash errors (crash_count) and non-crash errors (non_crash_count) over time through stacked area charts, quickly identifying abnormal periods and error type trend changes.
Crash Errors (crash_count): Serious errors causing forced app exit
Non-crash Errors (non_crash_count): Caught exceptions, app can continue running but functionality may be affected

Page Crash Ranking (Top10)#

Lists pages or view controllers with the most crashes, each record contains:
Error Type: Crash exception type (e.g., java.lang.RuntimeException, SIGTRAP, etc.)
Error Message: Detailed error description to help quickly locate issues
Error Count: Total occurrences of this error on this page
Session Count: Number of sessions (user visits) affected by this error
This ranking helps you prioritize handling the most impactful page crash issues.

Top Issues (Top10)#

Shows ranking of issues affecting the most users, each Issue is an aggregated error collection, containing:
Error Type: Primary error type of the Issue (e.g., java.lang.RuntimeException, TypeError, ReferenceError, etc.)
Error Message: Typical error description of the Issue, click to view detailed stack and session information
Error Count: Total error occurrences contained in this Issue
Session Count: Number of sessions affected by this Issue
Note: One Issue may aggregate multiple errors with the same root cause. For Issue aggregation strategy, see Error Grouping.

Error Type Distribution#

Error Type Proportion (Pie Chart): Shows proportion of different error types (e.g., ReferenceError, java.lang.RuntimeException, etc.), quickly identifying main error sources.
Error Type Distribution Trend (Stacked Area Chart): Monitors change trends of each error type over time, detecting new error types or abnormal growth of certain errors in time.

Version Crash Distribution#

Version Crash Distribution (Pie Chart): Counts crash distribution across different app versions, identifying high-risk versions.
Version Crash Distribution Trend (Stacked Area Chart): Monitors crash changes for each version over time, evaluating new version quality, performing hot fixes or rollbacks when necessary.

System Version Exception Distribution#

System Version Exception Distribution (Pie Chart): Counts exception distribution across different OS versions (e.g., Android 11, Android 12, iOS 15, etc.), identifying system compatibility issues.
System Version Exception Trend (Stacked Area Chart): Monitors exception changes for each system version over time, providing data support for system compatibility optimization.
For in-depth analysis of specific errors, see Error Tracking to learn how to investigate key errors, view error stacks, track appearance of new errors, and verify effectiveness after problem fixes.

4. Resource Analysis — Fine-grained Network Performance Optimization#

2026-01-13-11-48-55
The resource analysis module helps you deeply understand app network request performance and identify optimization opportunities:
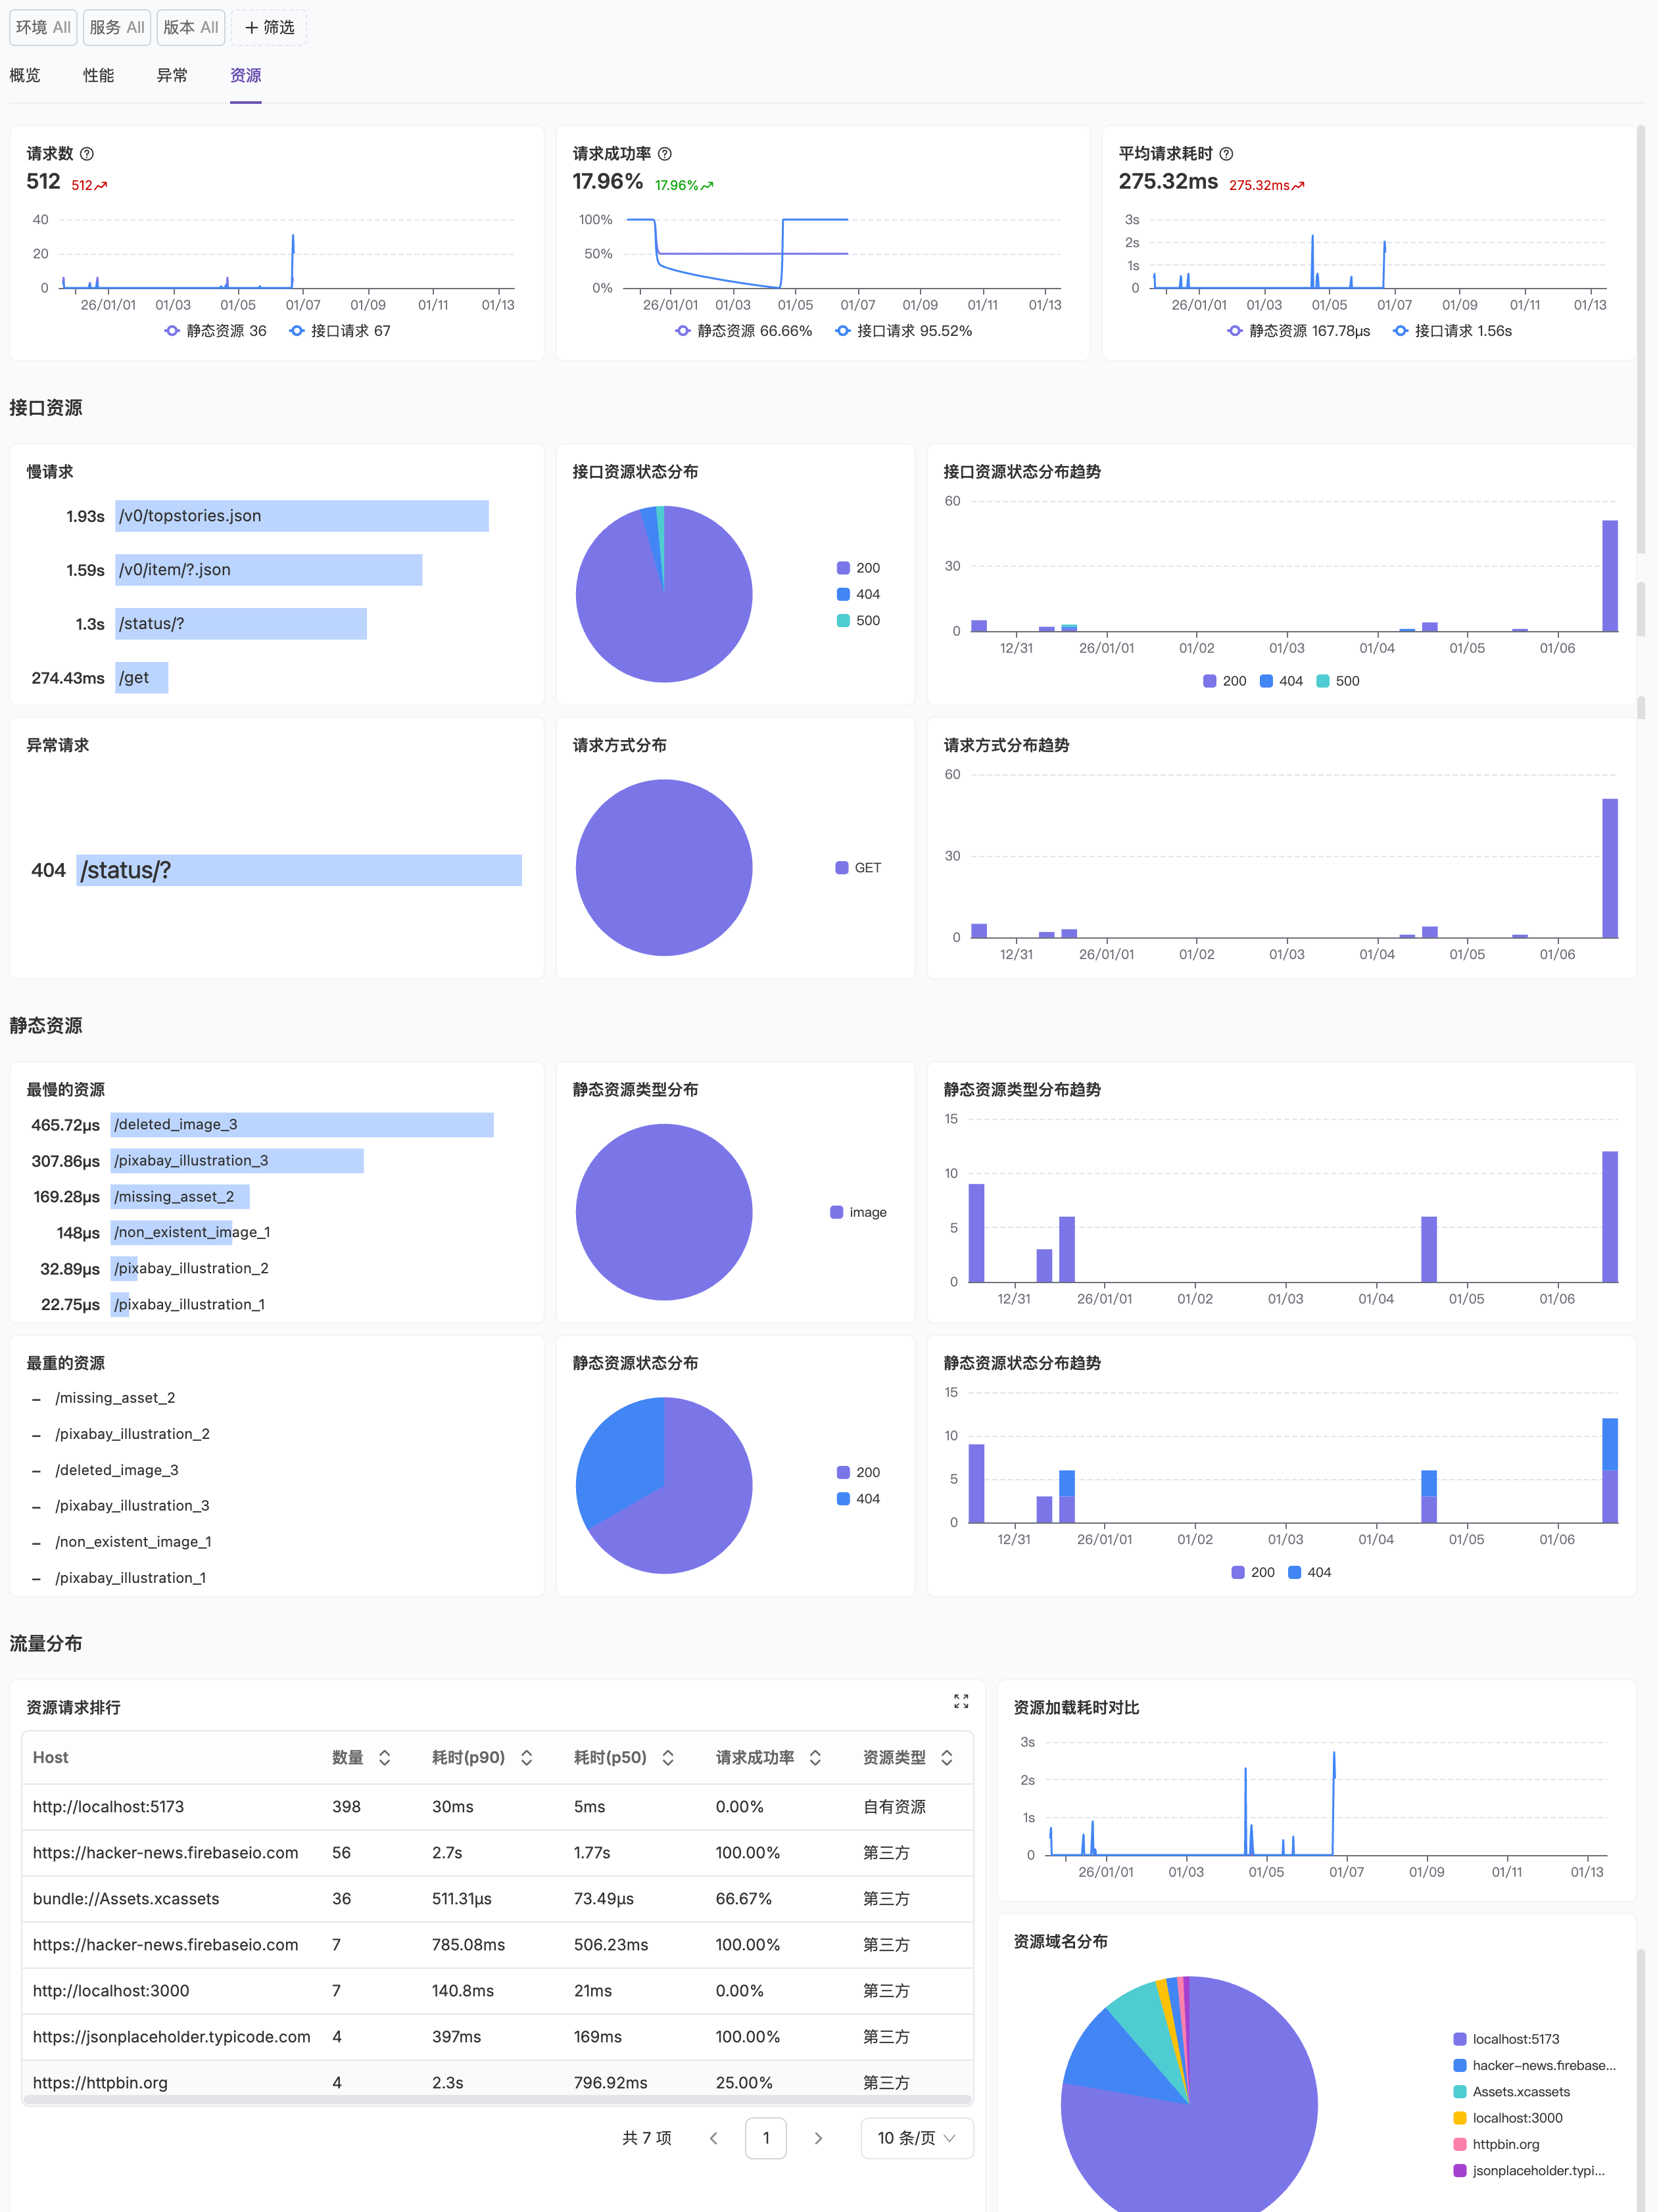
Request Count: Monitors network request volume change trends, understanding app network activity.
Request Success Rate: Tracks proportion of successful requests, detecting network anomalies in time.
Median Request Time: Shows median request duration changes (e.g., p50, p75, p95), evaluating overall network performance level.
Slow Requests: Counts slow request trends with response time exceeding threshold, locating performance bottlenecks.
Abnormal Requests: Monitors failed or error request occurrences, quickly identifying API issues.
Request Status Distribution:
Request Status Code Proportion: Shows distribution of different HTTP status codes through pie chart (e.g., 200, 404, 500), identifying abnormal request types.
Request Status Code Trend: Monitors status code changes over time, detecting abnormal peaks in time.
Request Method Distribution:
Request Method Proportion: Shows usage distribution of different HTTP methods (GET, POST, etc.).
Request Method Trend: Analyzes time-series changes of each request method.
Static Resources:
Static Resource Call Ranking: Lists most frequently called static resources (e.g., images, fonts, config files), understanding resource usage popularity.
Static Resource Response Ranking: Identifies slowest responding static resources, optimizing resource loading performance.
Network Call Ranking:
Host Ranking: Counts request count by request source (Host), identifying main dependent service endpoints.
Resource Duration Ranking: Lists longest duration network requests, including duration details (DNS resolution, TCP connection, SSL handshake, first byte time, response time, etc.), precisely locating performance bottlenecks.

Frequently Asked Questions#


Why is the status code for some network requests 0?#

1.
Request Canceled: User left page or canceled operation before request completion, causing request interruption.
2.
Network Interruption or Timeout: Request encountered network interruption, timeout, or other exceptions during sending, possibly causing status code not to return normally.
3.
Certificate Verification Failed: HTTPS request SSL certificate verification failed, connection interrupted before establishment.
4.
SDK Compatibility: In rare cases, specific system versions or devices may have compatibility issues, causing incomplete data collection.

What is the difference between error count and Issue count?#

Error Count: Refers to total count of raw error events, including every error occurrence record.
Issue Count: Refers to count of problems after aggregation. Flashduty aggregates similar errors into the same Issue based on error stack, error type, occurrence location, and other information.
Example:
Total Error Count: 100
Issue Count: 5
This indicates that 100 errors were aggregated into 5 different Issues, each possibly caused by different root causes.
Why aggregation is needed:
Facilitate locating problem root cause: errors with same root cause grouped into one Issue, avoiding duplicate processing
Priority sorting: identify problems most needing fixes through impact scope (error count, session count)
Track fix effectiveness: after fixing one Issue, observe whether all errors under that Issue disappear
Learn more about Error Grouping Strategy.

How to improve crash-free rate?#

1.
Locate High-frequency Crashes: Quickly locate most impactful crash issues through "Page Crash Ranking" and "Top Issues".
2.
Analyze Stack Information: Click specific Issue to view detailed error stack and user environment information, precisely locating problem code.
3.
Focus on System Compatibility: Identify specific system version compatibility issues through "System Crash Distribution".
4.
Monitor Version Quality: Evaluate new version quality through "Version Distribution", perform hot fixes or rollbacks when necessary.
5.
Enhance Exception Capture: Properly use try-catch, global exception handlers to avoid uncaught exceptions causing crashes.

How to optimize app startup performance?#

1.
Analyze Startup Data:
View "Application Startup Time (P75)" metric to understand most users' startup experience
Evaluate optimization effectiveness through "Startup Time Trend Chart", avoiding performance regression
View "Sample Distribution Histogram" to identify long-tail issues, ensuring minority users also get good experience
2.
Delay Non-critical Initialization: Defer non-essential initialization operations until after first screen render to shorten startup time.
3.
Optimize Dependency Loading: Reduce third-party SDKs and libraries loaded during startup, adopt lazy loading strategy.
4.
Simplify First Screen Layout: Reduce homepage view hierarchy complexity, decrease first render time.
5.
Use Startup Optimization Tools:
Android: Use App Startup Library to manage component initialization order
iOS: Utilize Lazy Initialization to defer non-critical component initialization
6.
Monitor Startup Phase Duration: Track duration of each phase through custom timing points, precisely locating bottleneck stages.

What do P75, P50, P90 percentiles mean?#

Percentiles are important metrics in statistics for measuring data distribution:
P50 (Median): 50% of users have better experience than this value, 50% have worse
P75: 75% of users have better experience than this value, 25% have worse
P90: 90% of users have better experience than this value, 10% have worse
P95: 95% of users have better experience than this value, 5% have worse
Why use P75 instead of average?
Average values are easily affected by extreme values and may not represent most users' real experience
P75 better reflects most users' experience, is an industry-standard performance evaluation metric
Google recommends using P75 as a core performance metric
Example:
App startup time P75 = 1.7s: indicates 75% of users have startup time within 1.7s, 25% exceed 1.7s
Memory usage P75 = 233MB: indicates 75% of scenarios have memory usage within 233MB

What are slow frames, frozen frames, and long tasks?#

These are all important metrics for measuring app smoothness:
Slow Frame:
Frame with rendering time exceeding 16.67ms (60fps standard)
Users perceive slight stutter
Acceptable occasionally, needs optimization if frequent
Frozen Frame:
Frame with rendering time exceeding 700ms
Interface completely frozen, users cannot interact
Seriously affects user experience, must fix
Long Task:
Task executing on main thread for more than 100ms
Blocks user interaction and interface updates
Common causes: complex calculations, large data processing, synchronous I/O
Optimization Recommendations:
Move time-consuming operations to background threads
Process large amounts of data in batches
Optimize algorithm complexity
Avoid synchronous network requests or disk I/O on main thread

How to improve page loading performance?#

1.
Locate Slow Pages: Identify slowest loading pages through "Page Loading Duration Ranking", prioritize optimization.
2.
Optimize Data Loading:
Adopt pagination loading or virtual list technology, avoid loading large amounts of data at once
Use data preloading and caching strategies to reduce wait time
Optimize network requests, merge API calls
3.
Simplify Page Layout:
Reduce view hierarchy nesting, lower layout calculation complexity
Avoid excessive use of transparent views and rounded corner effects
Defer loading of non-first-screen content
4.
Optimize Image Resources:
Use appropriate image formats and sizes
Adopt progressive loading or placeholder images
Compress and cache images
5.
Asynchronous Rendering: Execute complex view rendering operations on background threads.

What is ANR, and how to reduce ANR rate?#

ANR (Application Not Responding) is Android system's application unresponsive mechanism:
When app main thread is blocked for more than 5 seconds, system pops up "Application Not Responding" dialog
User can choose "Wait" or "Close App"
ANR seriously affects user experience, may cause user to uninstall app
Common ANR Causes:
1.
Main Thread Executing Time-consuming Operations:
Synchronous network requests
Large file read/write
Complex calculations
Database operations
2.
Main Thread Waiting for Locks:
Deadlock between threads
Waiting for other threads to release locks
3.
Insufficient System Resources:
CPU occupied by other apps
Insufficient memory causing frequent GC
How to Reduce ANR Rate:
1.
Avoid Main Thread Blocking:
Move time-consuming operations to background threads (use AsyncTask, Coroutines, RxJava, etc.)
Use asynchronous APIs instead of synchronous APIs
Avoid network requests and file I/O on main thread
2.
Optimize Lock Usage:
Reduce lock holding time
Avoid nested locks
Use lock-free data structures
3.
Optimize Lifecycle Methods:
Lifecycle methods like onCreate/onResume should return quickly
Delay loading of non-critical resources
4.
Monitoring and Analysis:
Use StrictMode to discover main thread violations during development
Locate issues through RUM dashboard's "Long Task Count" and "Freeze Frequency"
View ANR stack information to locate specific code

How to reduce app freeze rate?#

1.
Locate Freeze Sources: Identify specific code causing freezes through "Long Task Monitoring" and "Freeze Duration Distribution".
2.
Optimize Main Thread Tasks: Move time-consuming operations (like network requests, database read/write, complex calculations, large file I/O) to background threads.
3.
Optimize UI Rendering:
Reduce view hierarchy, lower layout complexity
Avoid complex view calculations on main thread
Use optimization techniques for RecyclerView (Android) or UITableView/UICollectionView (iOS)
Properly use hardware acceleration
4.
Optimize List Performance:
Implement view reuse mechanism
Optimize item layout complexity
Avoid time-consuming operations during item binding
5.
Combine Monitoring Tools: Use performance analysis dashboard in combination with system tools (Android Profiler, Xcode Instruments) to locate specific freeze code.
6.
Set Reasonable Thresholds: Set reasonable freeze detection thresholds (recommended 200-500ms) based on business characteristics and user expectations.

How to collect user information?#

1.
Logged-in User Identification: For apps requiring user login (e.g., e-commerce, social, finance), you can call SDK's user identification method after user login:
Android: Refer to Android User Session Configuration
iOS: Refer to iOS User Session Configuration
2.
Device Fingerprint Identification: For apps without login state, recommend generating stable device fingerprints based on device information and reporting user identifiers:
Android: Can use Android ID, IMEI (requires permission), Advertising ID, etc.
iOS: Can use IDFV (Identifier for Vendor) or IDFA (requires user authorization)

How to optimize network request performance?#

1.
Identify Slow Requests: Locate longest response time APIs through "Resource Duration Ranking".
2.
Analyze Duration Distribution: View duration of each phase like DNS resolution, TCP connection, SSL handshake, first byte time to precisely locate bottlenecks.
3.
Optimization Recommendations:
DNS optimization: Use DNS caching, HTTPDNS
Connection optimization: Enable HTTP/2, connection reuse, reduce redirects
Transfer optimization: Enable GZIP compression, optimize data format, reduce request size
API optimization: Optimize backend API performance, use CDN to accelerate static resources

What is the data latency?#

Flashduty RUM typically completes collection and display within 1-3 minutes after data generation. Under good network conditions, most data can achieve near real-time updates.

Further Reading#


SDK Integration and Configuration#

Android SDK Integration Guide - Learn how to integrate RUM SDK in Android apps
iOS SDK Integration Guide - Learn how to integrate RUM SDK in iOS apps
Android Advanced Configuration - In-depth configuration of Android RUM SDK advanced features
iOS Advanced Configuration - In-depth configuration of iOS RUM SDK advanced features
Android Data Collection - Understand data types collected by Android RUM SDK
iOS Data Collection - Understand data types collected by iOS RUM SDK

Data Analysis and Monitoring#

RUM Explorer Usage Guide - Learn how to use RUM Explorer for in-depth data analysis
Error Tracking - Master error tracking and debugging techniques
Error Grouping Strategy - Understand error aggregation mechanism

Performance Optimization#

Android Performance Optimization Best Practices
iOS Performance Optimization Best Practices

添加官方技术支持微信

在这里,获得使用上的任何帮助,快速上手FlashDuty

微信扫码交流
修改于 2026-01-16 07:59:43
上一页
Web
下一页
Metrics
Built with